NEET UG · Video

PGR Interactions NEET Botany Guide
Master PGR interactions and external controls for NEET UG with TopAll.
5 min video

NEET UG · Biology
Revise the concepts. Try a question. Understand your next step.
64 easy questions available · Try answers free. Sign in to save progress or take a quiz.
NEET UG · Biology
Understand the concept, practise questions and check your learning.
Understand
Distinguish arithmetic and geometric models, calculate growth on a stated basis and connect root regions with changing cell behaviour. Plant growth: compare the rule, the rate and the region
Read the guidePractise
Try 64 easy chapter MCQs. Untimed; check answers and available explanations as you go.
Practise chapter MCQsCheck your learning
Prepare a timed chapter quiz. Choose the available question count and pace before starting.
Prepare a chapter quizThis is chapter practice, not a full-length NEET mock paper.
These are playable question counts after quality and duplicate checks.
The practice player uses single-correct-answer MCQs. Chapter quizzes are not full-length NEET mock papers. Check the practice guide and official syllabus sources.
Revise before you practise
NEET UG · Video
Master PGR interactions and external controls for NEET UG with TopAll.
5 min video
NEET UG · Video
Understand abscisic acid and stress responses for NEET UG with TopAll.
4 min video
NEET UG · Video
Learn ethylene hormone and its effects on plants for NEET UG with TopAll.
5 min video
NEET UG · PDF notes
Read PDF · 9 pages →Master PGR interactions and external control for NEET UG with TopAll.
9 pages
NEET UG · PDF notes
Read PDF · 8 pages →Understand abscisic acid and stress responses for NEET UG with TopAll.
8 pages
NEET UG · PDF notes
Read PDF · 10 pages →Learn ethylene hormone and plant responses for NEET UG with TopAll.
10 pages
NEET UG · Mind map
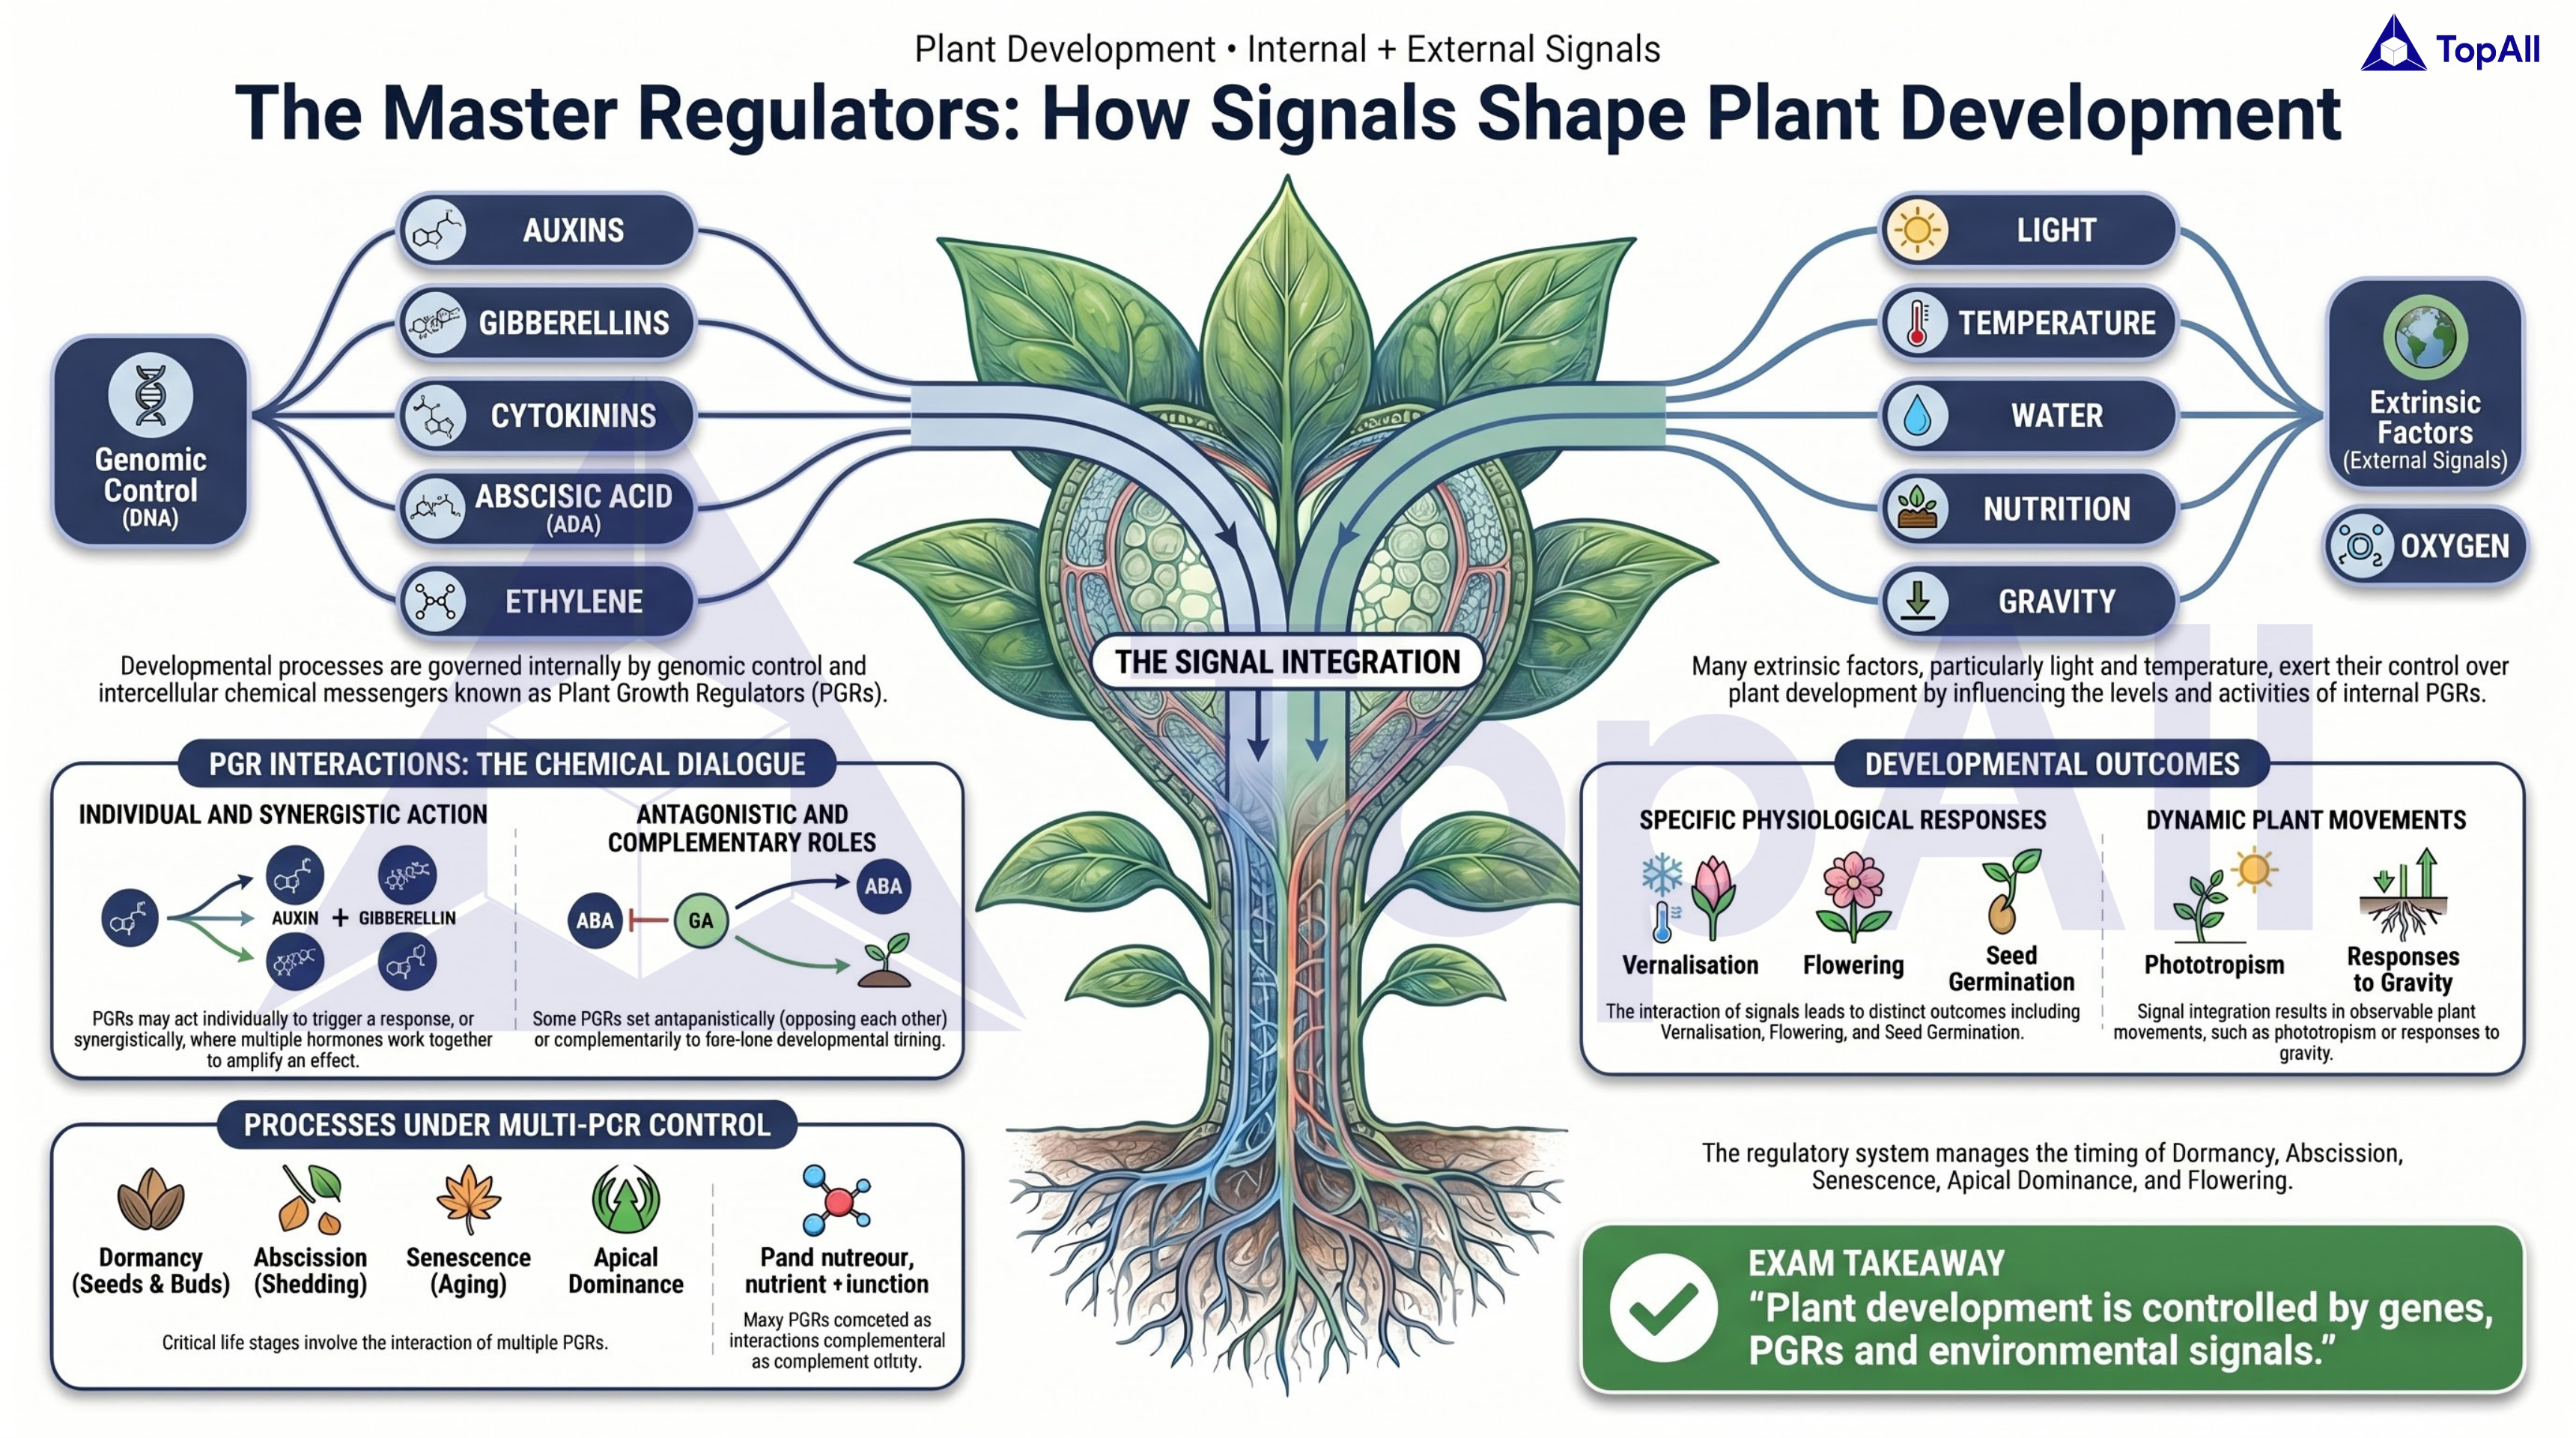
Master PGR interactions and external control for NEET UG with TopAll.
NEET UG · Mind map
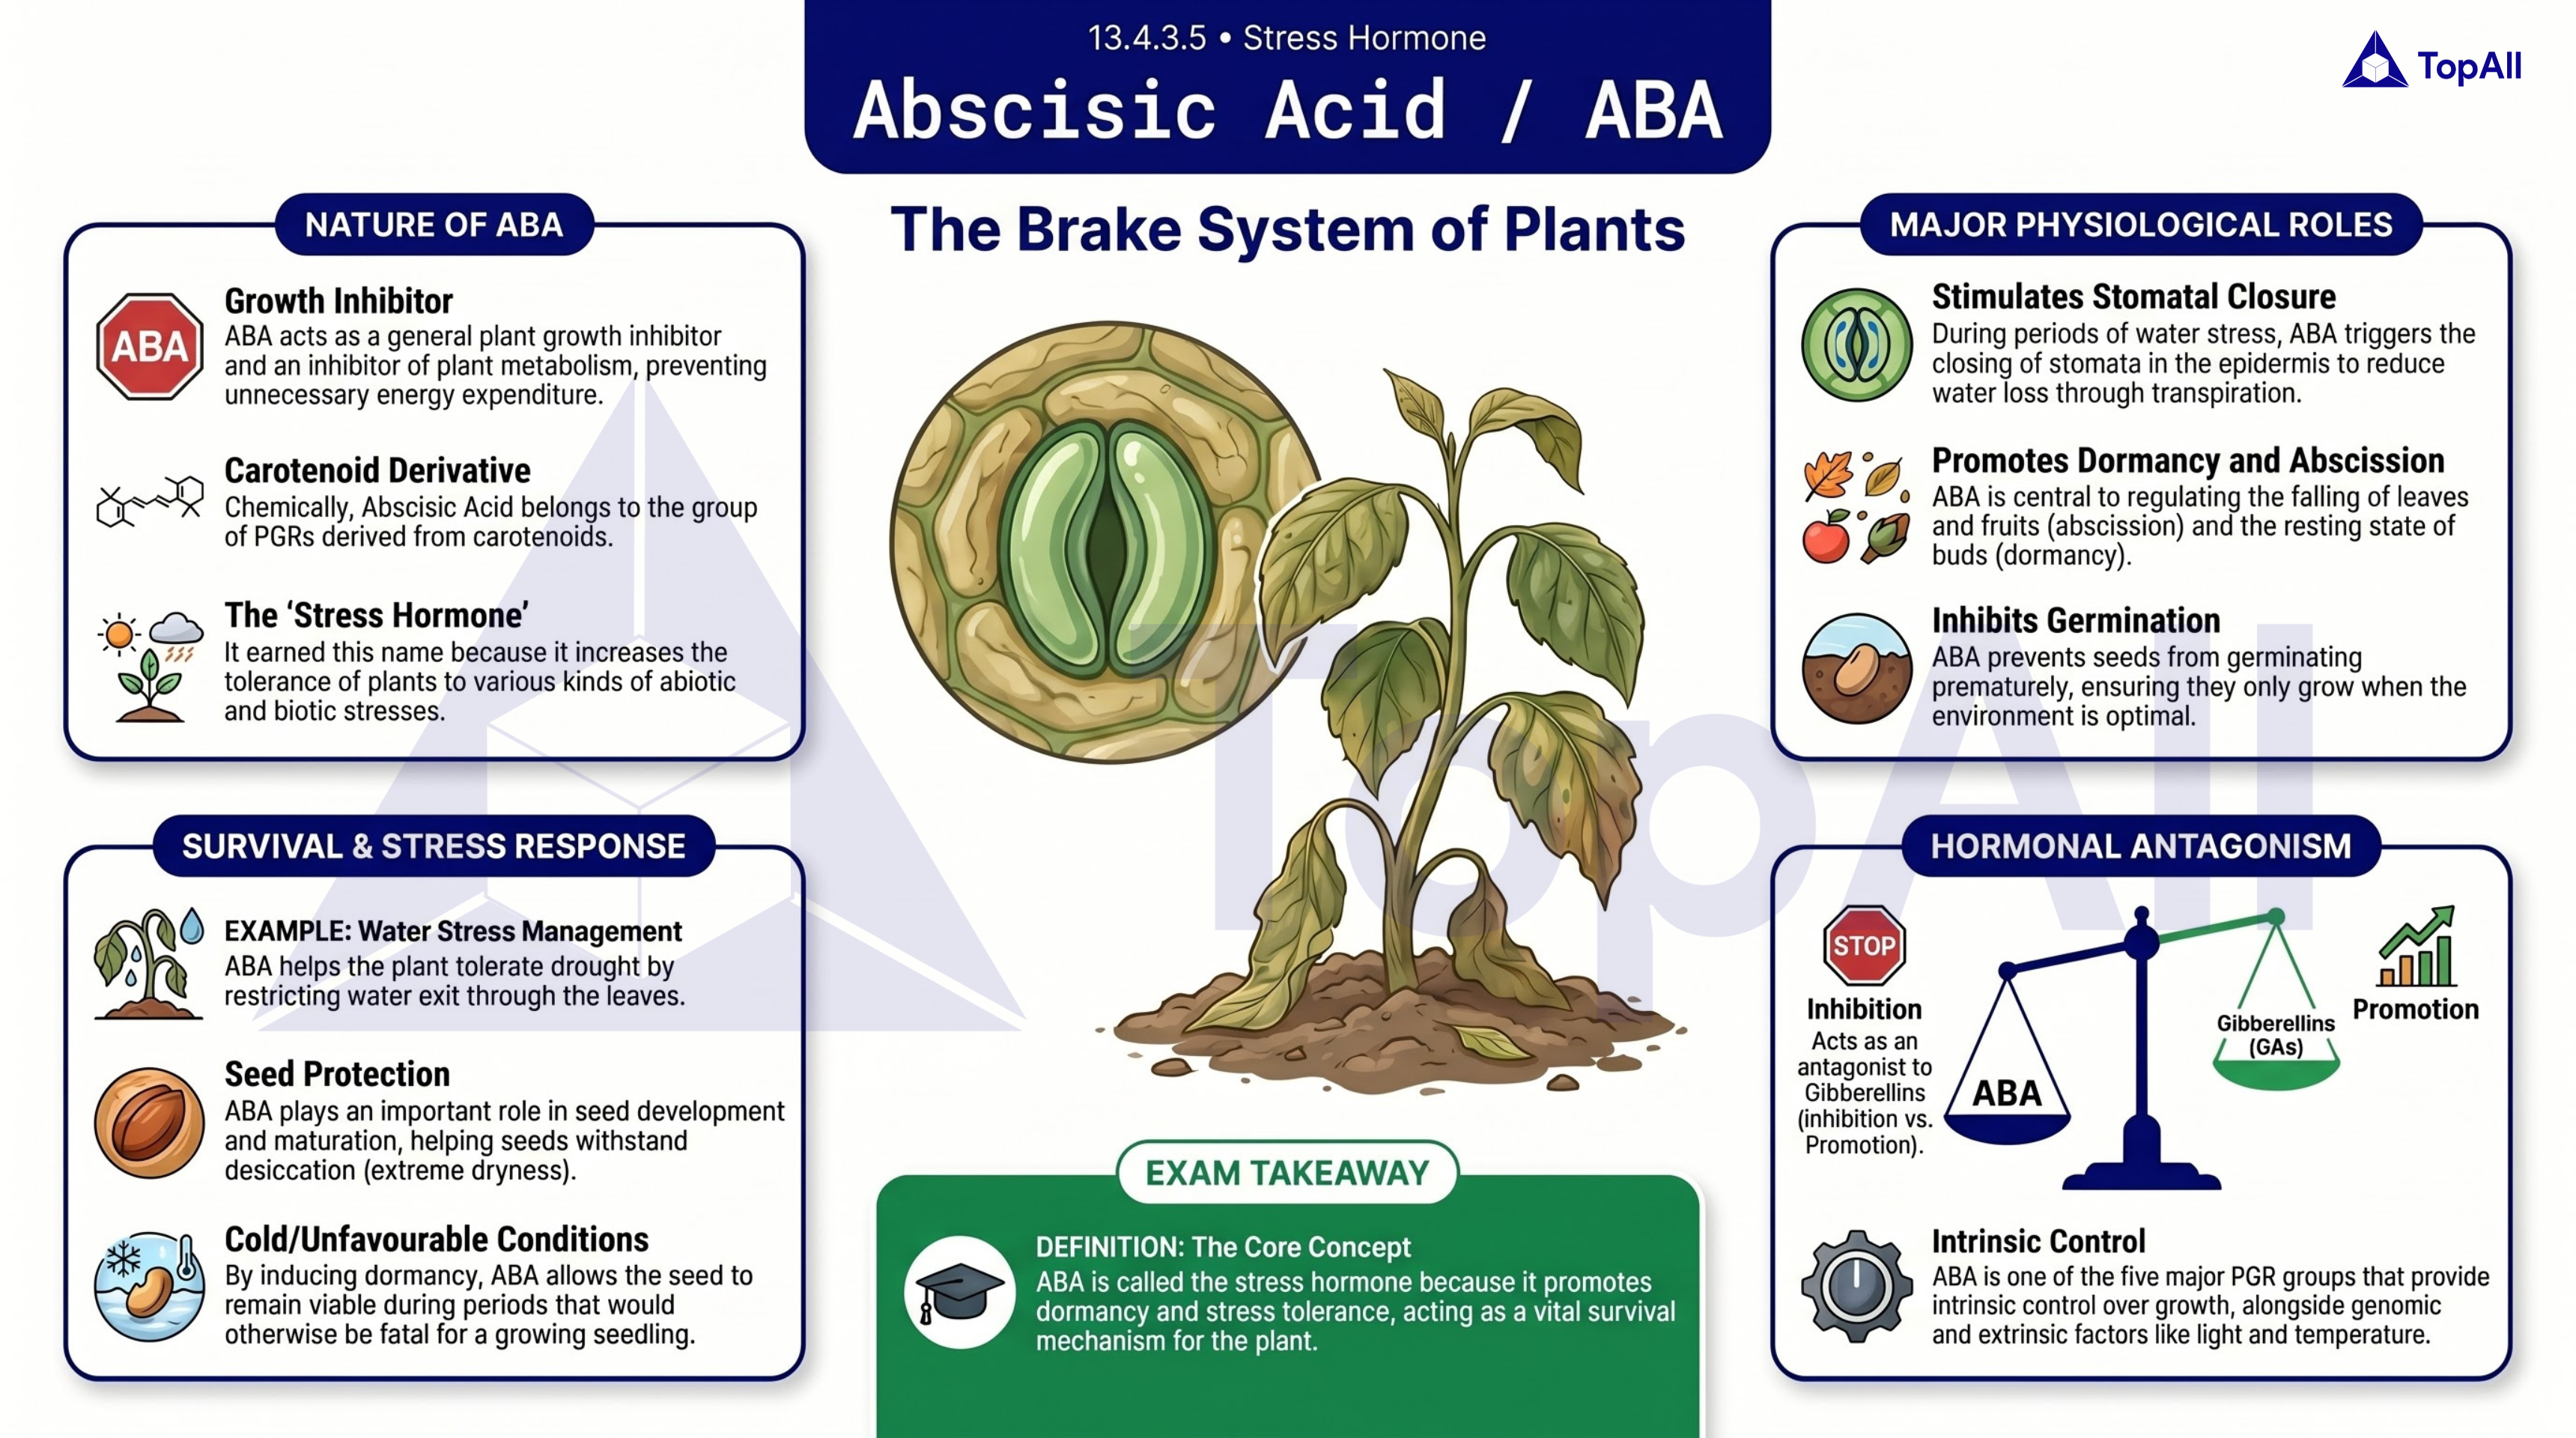
Understand abscisic acid and stress responses for NEET UG with TopAll.
NEET UG · Mind map
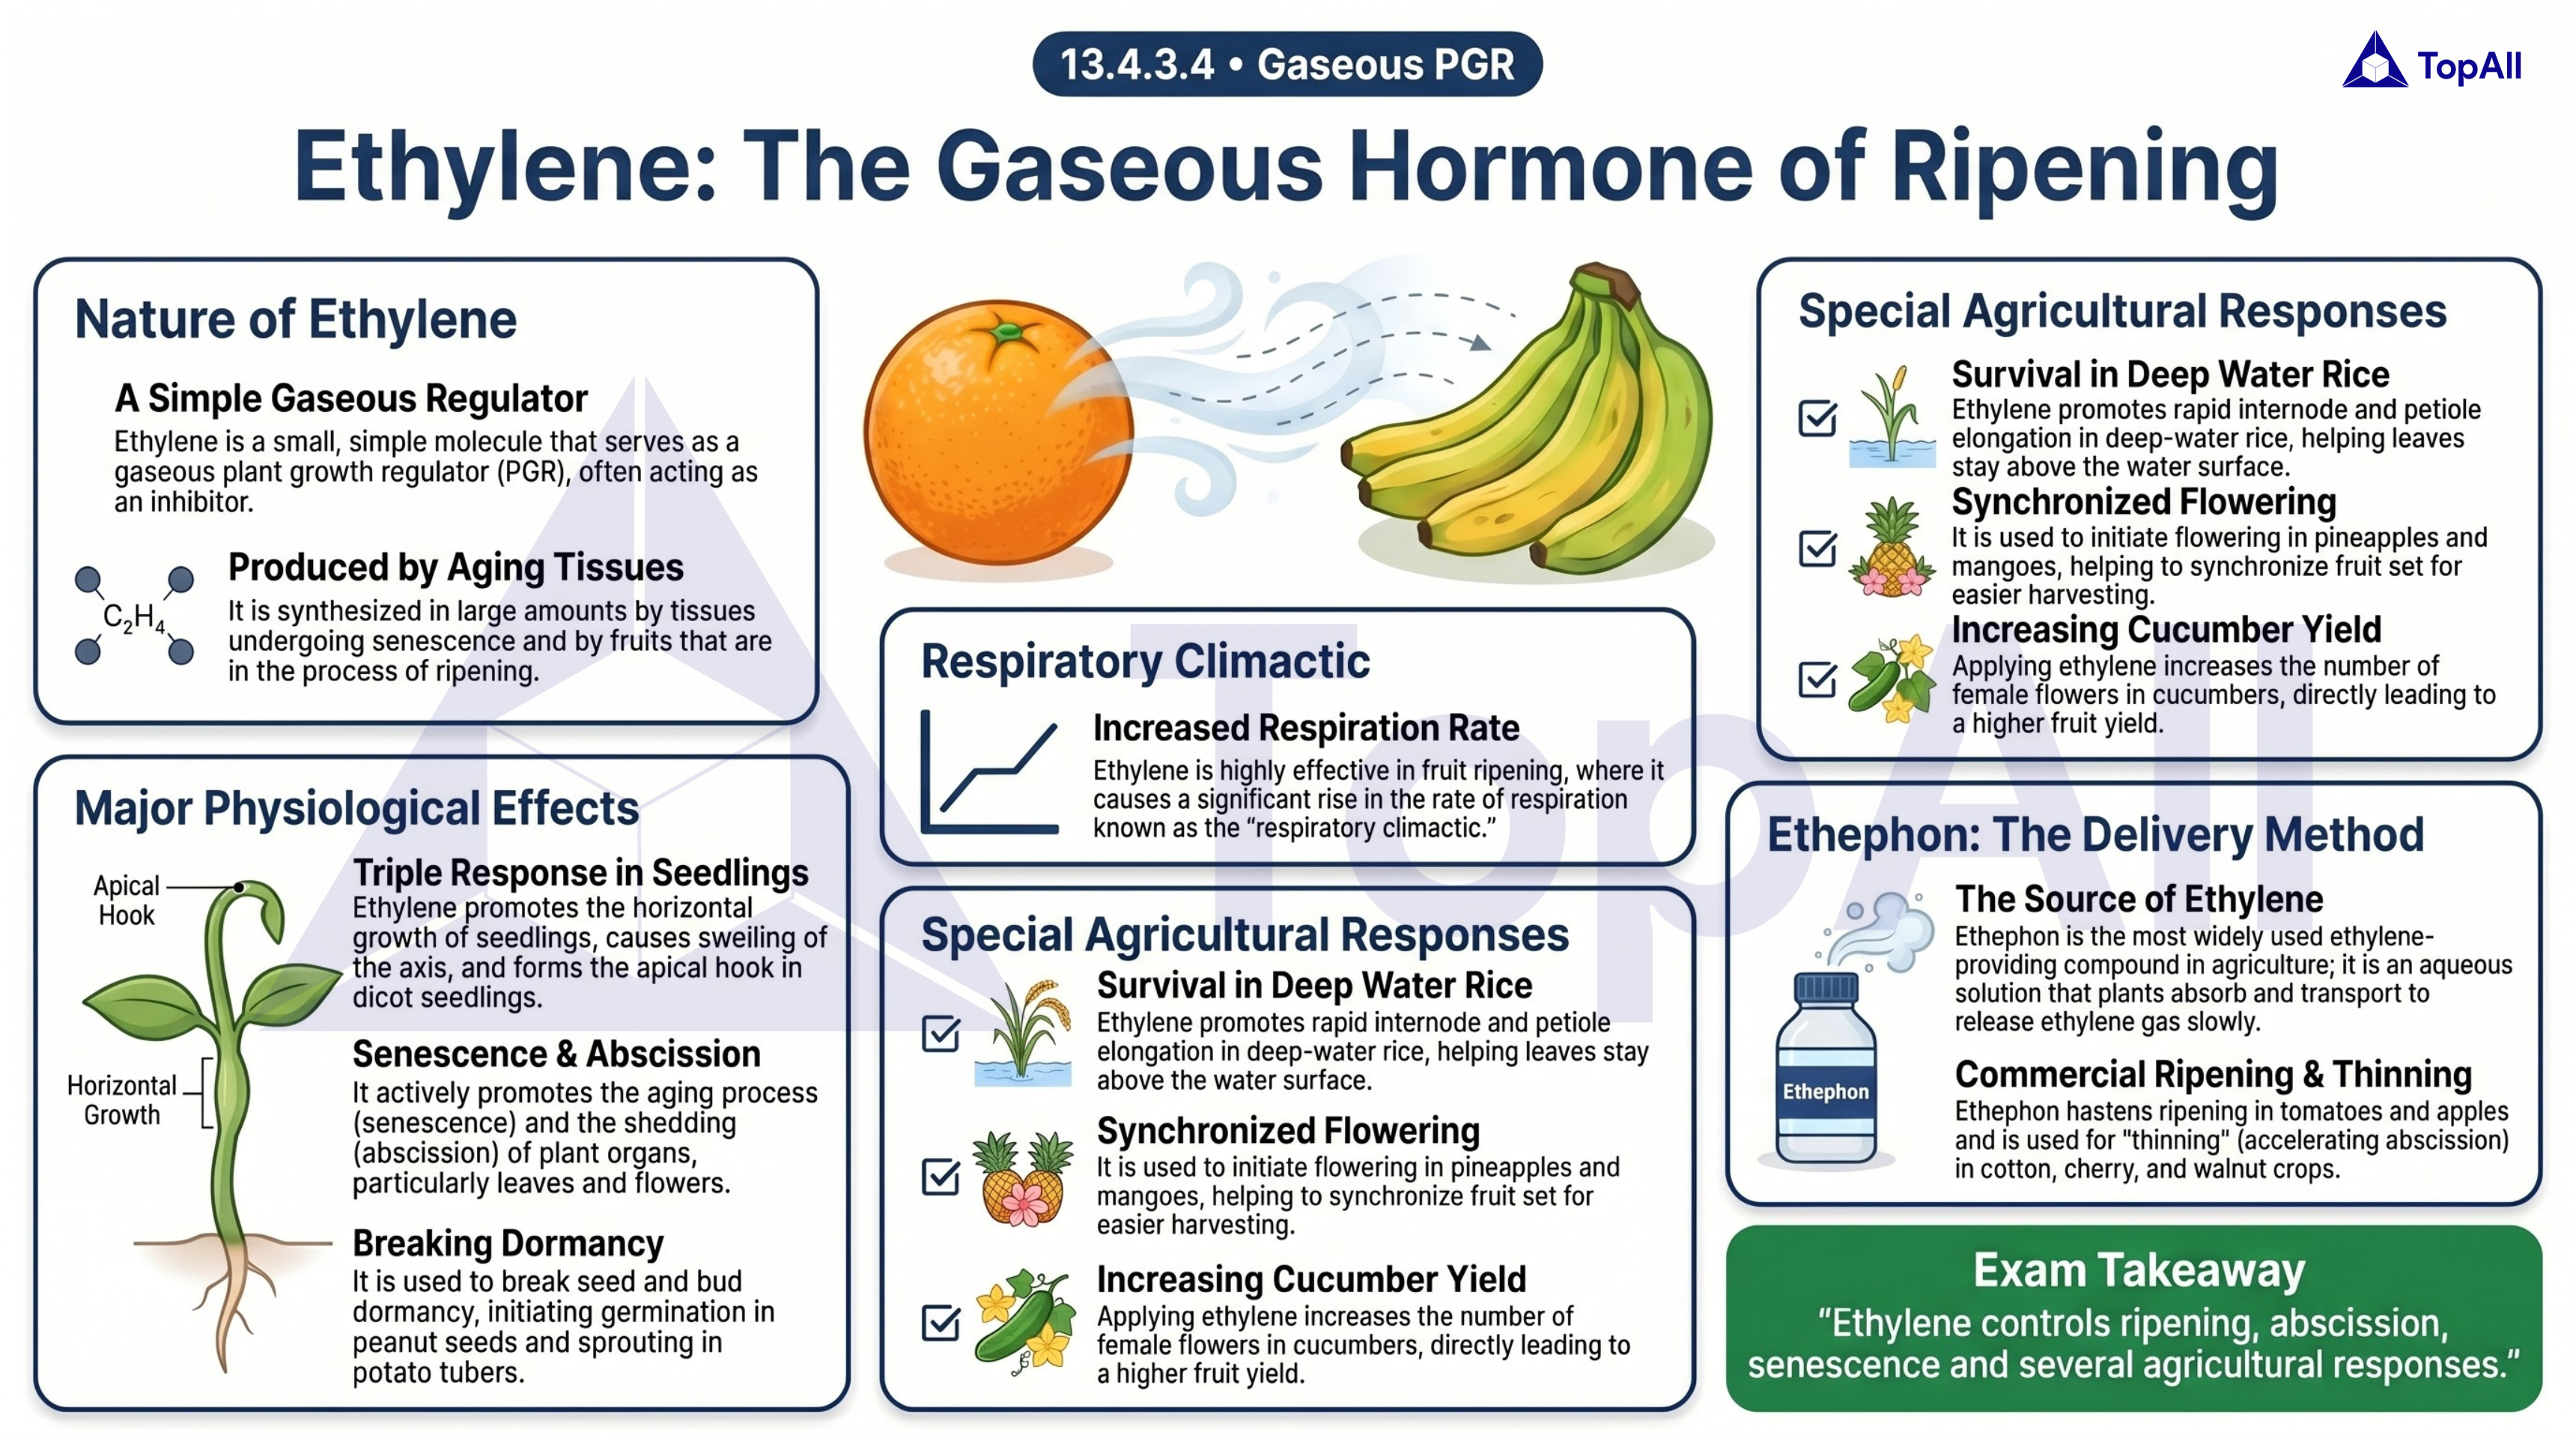
Learn ethylene hormone and plant responses for NEET UG with TopAll.
Distinguish arithmetic and geometric models, calculate growth on a stated basis and connect root regions with changing cell behaviour.
For NEET UG Biology students: distinguish equal additions from equal factors, compare growth on the stated basis and locate division, elongation and maturation relative to the root tip.
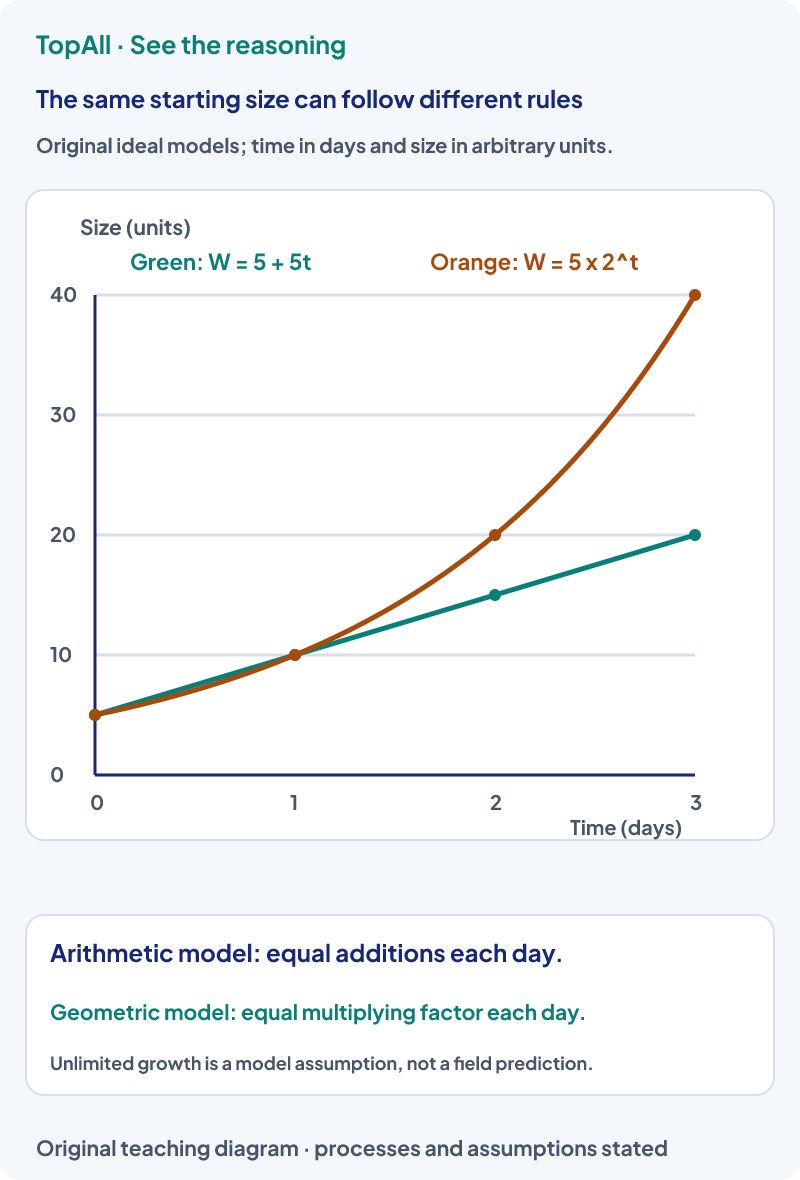
A rise in length, area, dry mass or cell number measures a particular aspect of growth. Absolute gain per time differs from gain expressed relative to a starting size. An arithmetic model adds a fixed amount in each interval; a geometric model multiplies by a fixed factor. Neither model alone guarantees unlimited growth in a plant with changing resources and conditions.
Assume a root begins at 4 mm and elongates at a constant 1.5 mm per day for six days. Use : final length is 4 + 1.5 × 6 = 13 mm, with a 9 mm increase. The final length and the increase answer different questions. The stated constant rate is a model assumption, not evidence that a real root keeps it indefinitely.
If two structures each gain two area units, their absolute gains are equal. A smaller starting area can nevertheless have the larger proportional gain. State whether the problem asks for absolute gain per day, percentage gain over an interval or a particular continuous relative-growth convention. A percentage change over two days is not automatically an instantaneous exponential rate.
Over the same two-day interval, leaf A increases from 4 to 6 cm² and leaf B from 20 to 22 cm². Both gain 2 cm² and average 1 cm² per day. Relative to their initial areas, gains are 50% and 10% over the interval. If the question explicitly requests gain per initial area per day, the values are 0.25 and 0.05 per day. These interval-based values are not silently substituted for a logarithmic growth-rate convention.
Cells produced by meristems acquire specialised structures and roles through differentiation. Some living differentiated cells can regain division capacity under suitable conditions, termed dedifferentiation; their descendants can specialise again. These processes are more specific than simply becoming larger. A change in shape or function and an increase in amount are related parts of development but need not answer the same question.
An original ideal size model starts at five units and doubles once per day. After three days it reaches forty, not twenty. The daily gains are five, ten and twenty, so the multiplying factor is constant while the increments grow. Extending the first gain of five as a constant daily addition would solve a different arithmetic model.
Plant-regulator effects depend on tissue, concentration, developmental state and interaction with other signals. A response observed in a shoot does not automatically predict the same response in a root. Before matching auxin, cytokinin, gibberellin, ethylene or ABA to an option, identify the organ, process and conditions supplied. Avoid treating “growth promoter” as a claim that every dose increases every kind of growth.
Write starting value, ending value and elapsed time separately. Keep units on every quantity and name the denominator for a relative comparison. For a root region, orient the tip before naming the zone. For a hormone response, read the organ and conditions rather than choosing from one remembered keyword.
A measured root length changes from 9 mm to 15 mm over three days. What is the average elongation rate, and does this prove that the rate was constant each day?
The gain is 6 mm, so the mean rate is 2 mm per day. It does not prove a constant daily rate; several different day-by-day patterns could give the same endpoints. A prediction beyond the interval would need a model or additional observations.
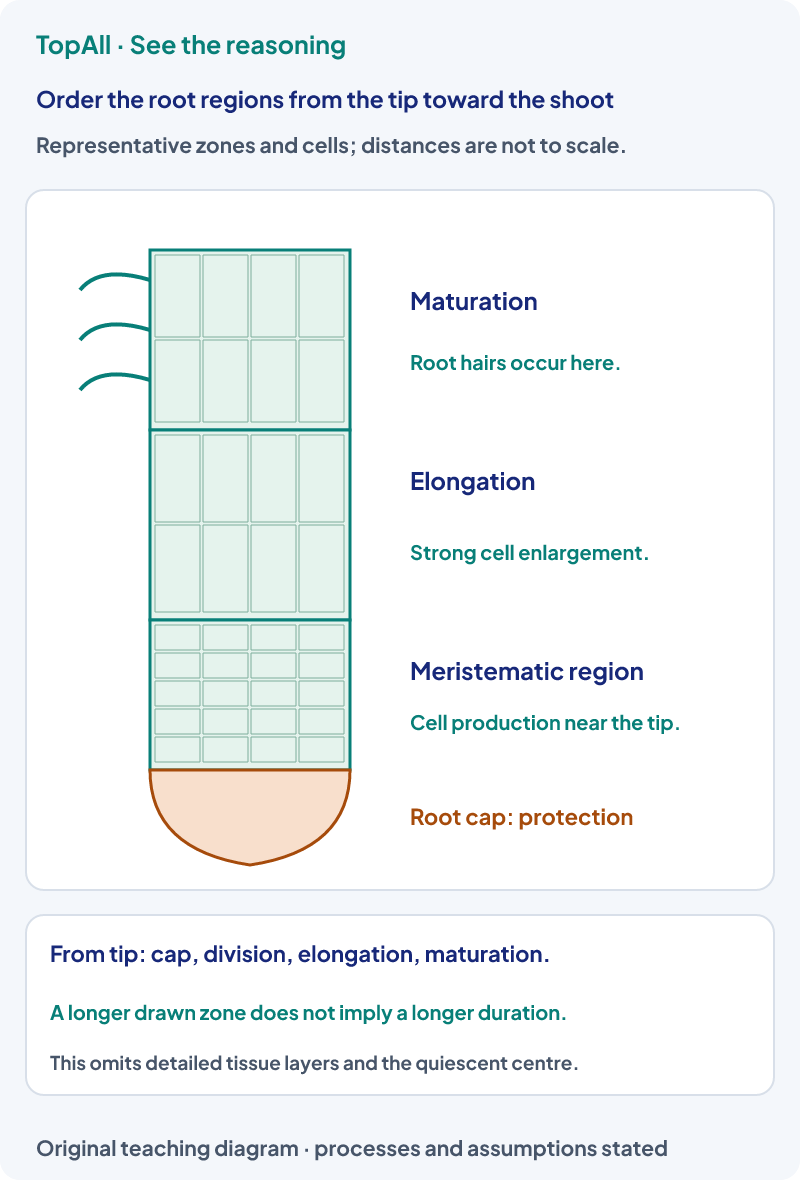
A root diagram places the protective cap at the bottom and shows epidermal outgrowths farther toward the shoot, beyond the elongation region. Which broad region is represented, and can its drawn length tell you how long cells remain there?
The root hairs indicate the maturation region in the stated model. The drawn length alone does not determine a residence time or growth rate. A schematic needs scale and temporal information before it can support that kind of quantitative inference.
Start with the same value, then compare adding five with doubling over three intervals. Rebuild the root-region order from the cap. Relate structural identity to Plant Morphology, or distinguish growth from production of a new individual in Reproduction in Organisms.
The practice action opens the broad growth-and-development pool rather than a growth-curve-only set.
Technical review: Codex (automated), 24 October 2026. Core mechanisms were compared with the linked primary textbooks and university or government references. All diagrams, problem inputs and explanations are original. Numerical balances and diagram directions are checked separately. Independent human subject review is not claimed. These focused guides support the existing chapter catalogue; they do not claim complete current exam or syllabus coverage.
For a numerical error, state final value, change and elapsed time separately. For a concept error, identify the process and organ before returning to the chapter pool.

