NEET UG · Video

Ramdeo Misra Ecology Guide
Learn Ramdeo Misra’s contribution to ecology in India for NEET UG with TopAll.
5 min video

NEET UG · Biology
Revise the concepts. Try a question. Understand your next step.
59 easy questions available · Try answers free. Sign in to save progress or take a quiz.
NEET UG · Biology
Understand the concept, practise questions and check your learning.
Understand
Balance population entries and exits, interpret logistic total growth and use stated effects to classify interactions. Population ecology: distinguish counts, rates and interaction effects
Read the guidePractise
Try 59 easy chapter MCQs. Untimed; check answers and available explanations as you go.
Practise chapter MCQsCheck your learning
Prepare a timed chapter quiz. Choose the available question count and pace before starting.
Prepare a chapter quizThis is chapter practice, not a full-length NEET mock paper.
These are playable question counts after quality and duplicate checks.
The practice player uses single-correct-answer MCQs. Chapter quizzes are not full-length NEET mock papers. Check the practice guide and official syllabus sources.
Revise before you practise
NEET UG · Video
Learn Ramdeo Misra’s contribution to ecology in India for NEET UG with TopAll.
5 min video
NEET UG · Video
Study predation and predator prey interactions for NEET UG with TopAll.
5 min video
NEET UG · Video
Learn population density and its measurement clearly for NEET UG with TopAll.
4 min video
NEET UG · PDF notes
Read PDF · 8 pages →Revise organisms and populations concepts for NEET UG with TopAll.
8 pages
NEET UG · PDF notes
Read PDF · 7 pages →Learn Ramdeo Misra’s contribution to ecology in India for NEET UG with TopAll.
7 pages
NEET UG · PDF notes
Read PDF · 9 pages →Study predation and predator prey interactions for NEET UG with TopAll.
9 pages
NEET UG · Mind map
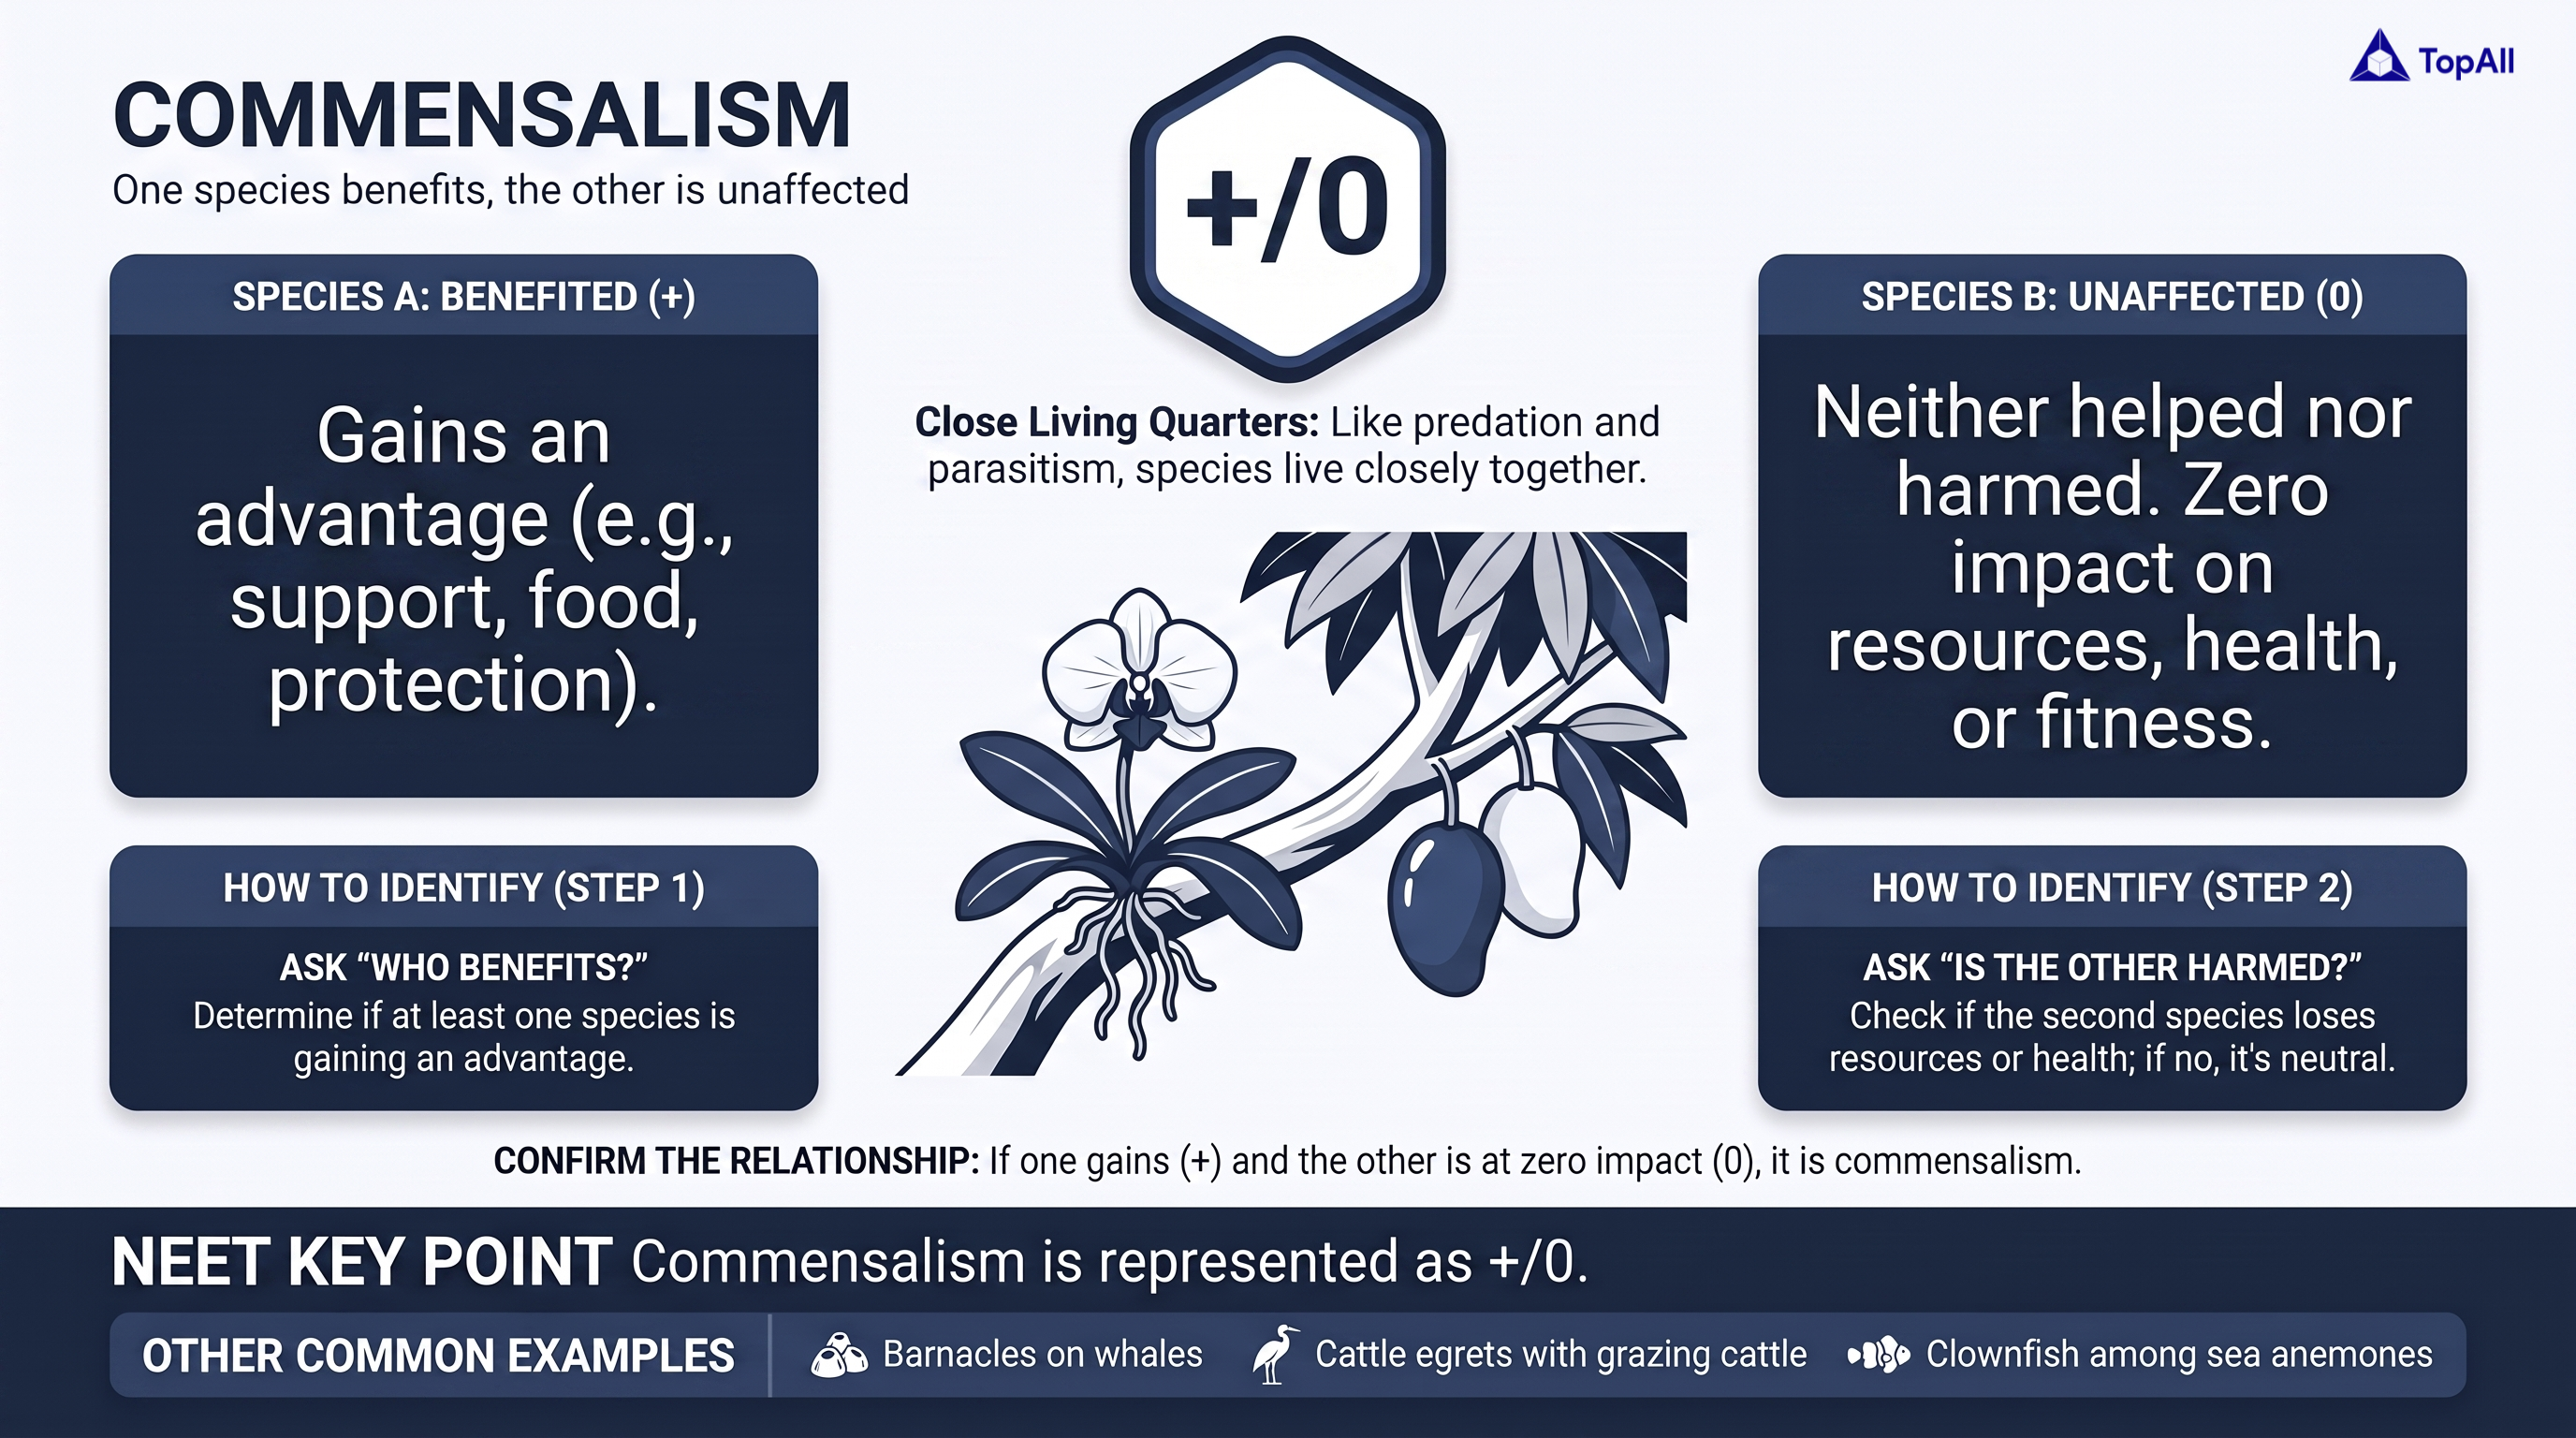
Understand commensalism in ecology for NEET UG with TopAll.
NEET UG · Mind map

Learn Ramdeo Misra’s contribution to ecology in India for NEET UG with TopAll.
NEET UG · Mind map
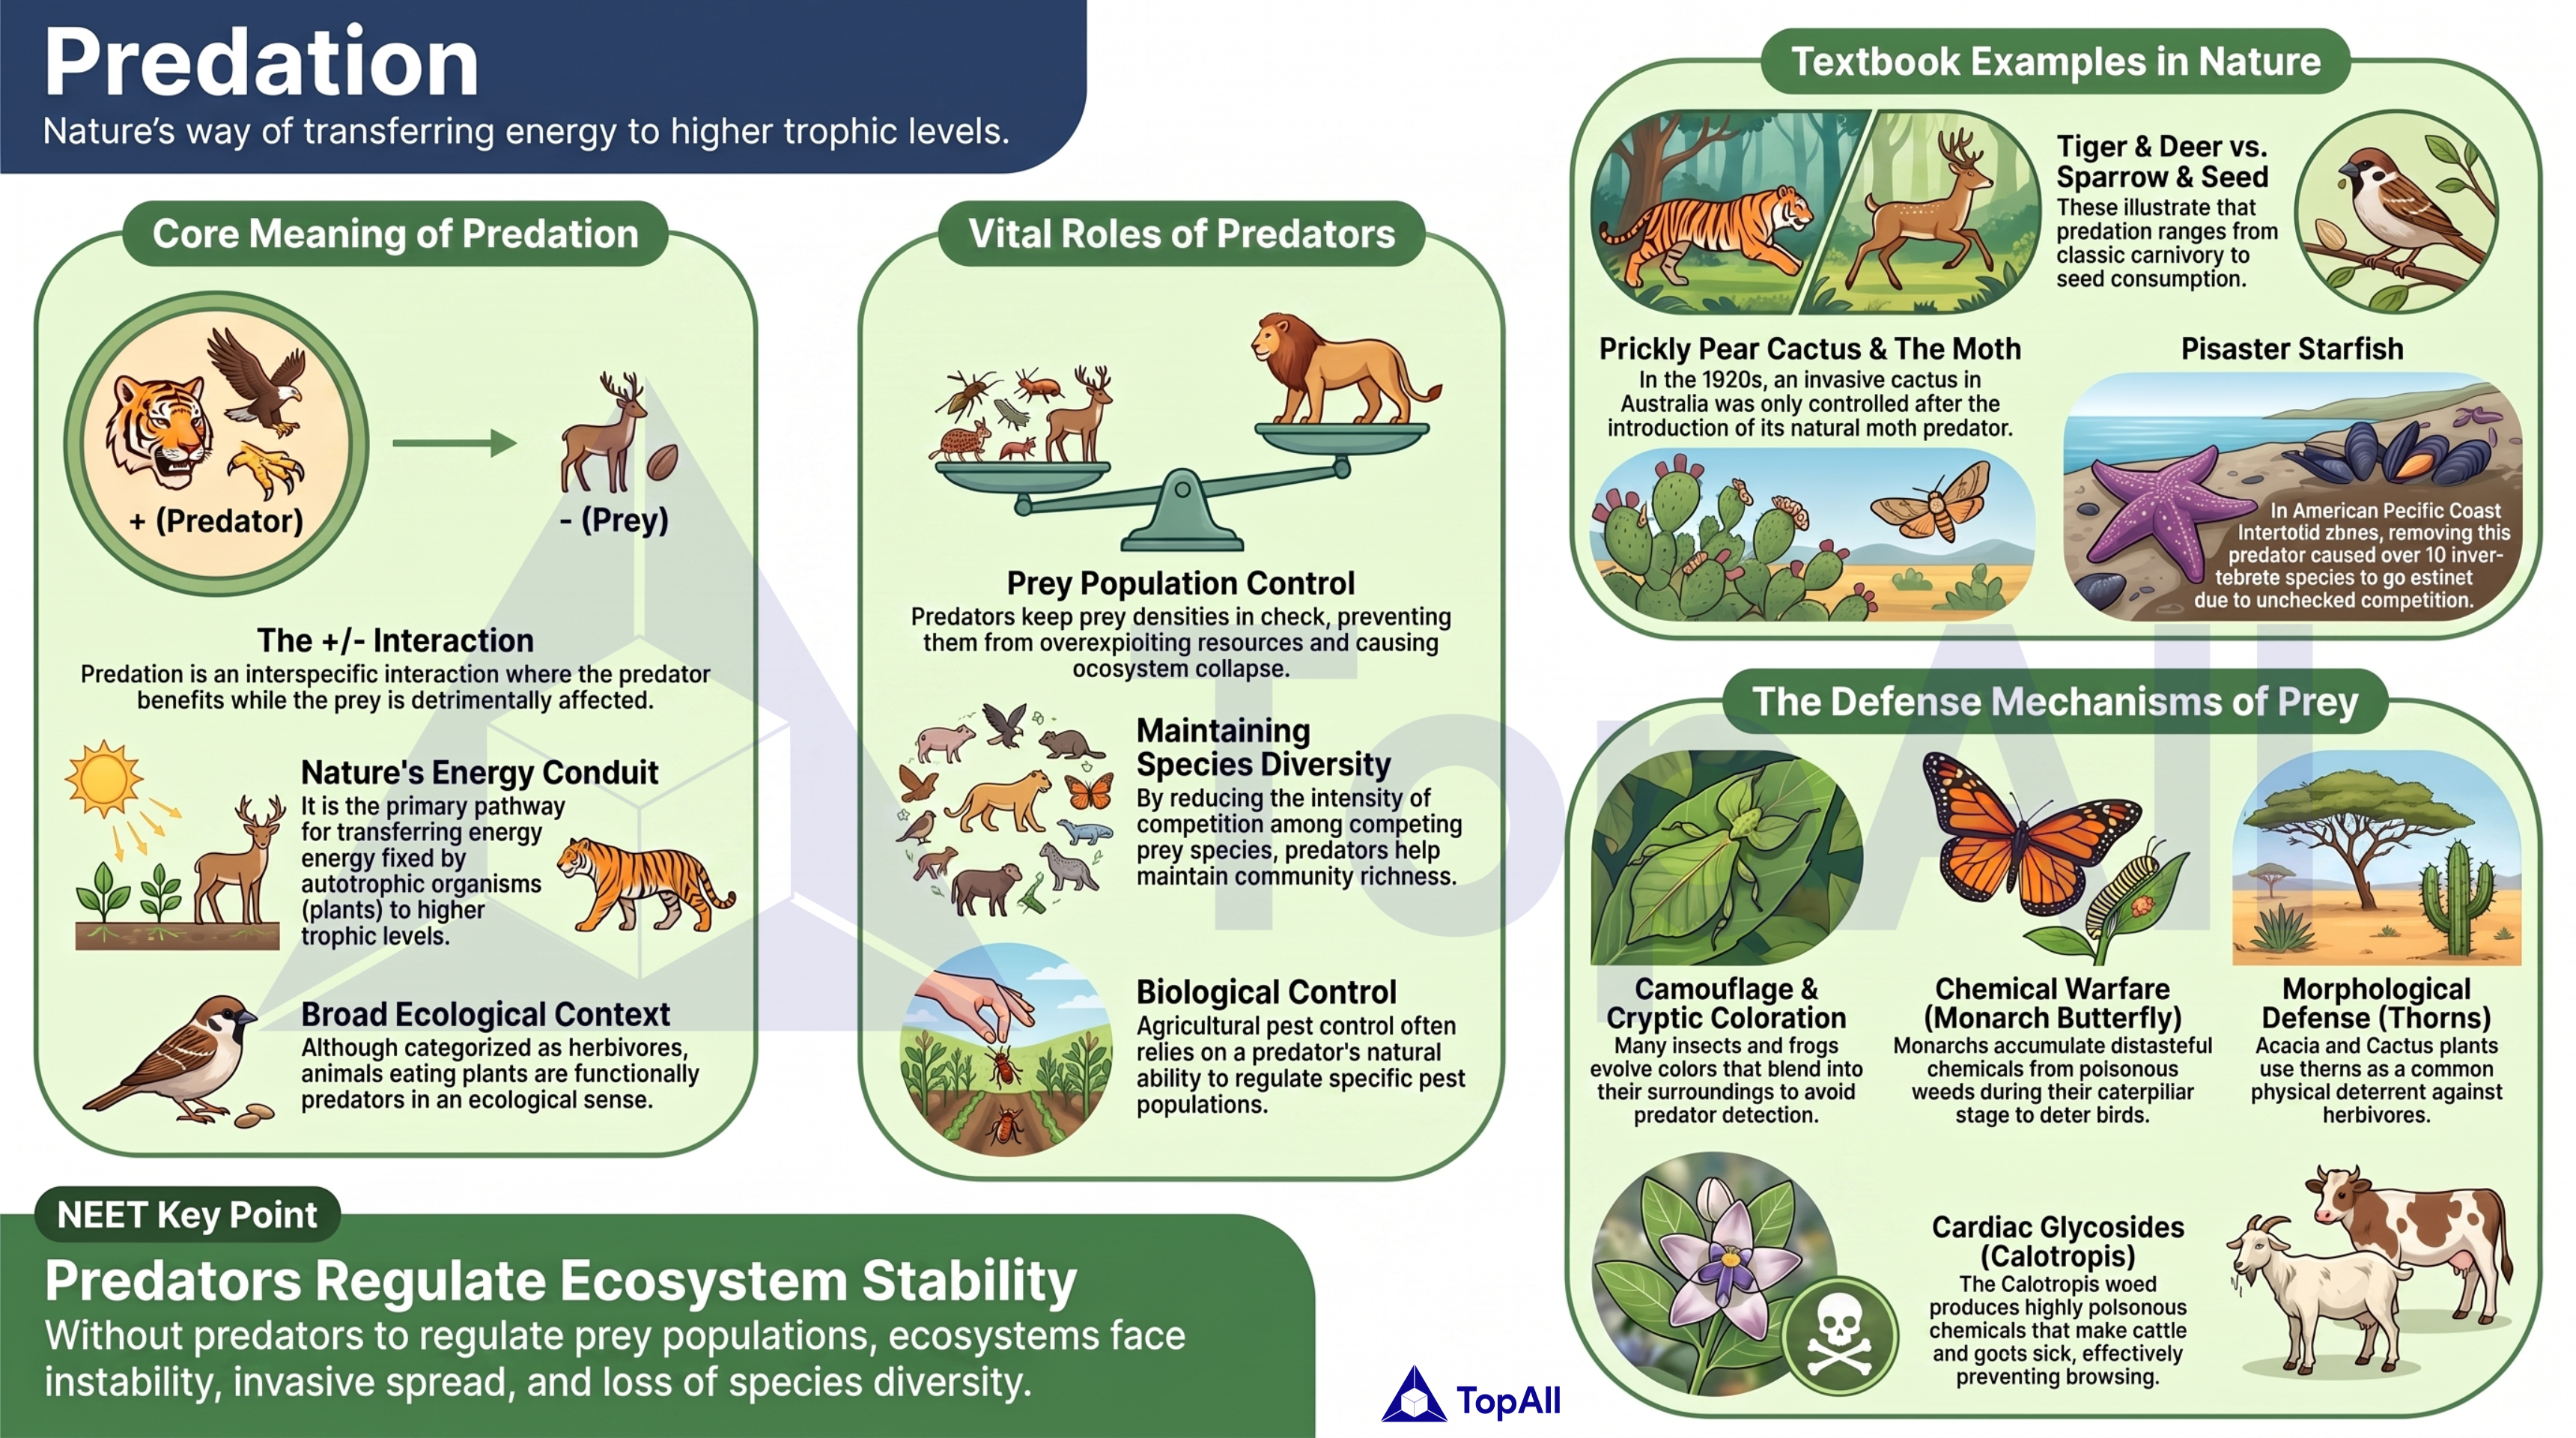
Study predation and predator prey interactions for NEET UG with TopAll.
Balance population entries and exits, interpret logistic total growth and use stated effects to classify interactions.
For NEET UG Biology students: balance entries and exits, distinguish total from per-capita logistic growth and classify interactions from stated effects.
Population change over one interval can be counted as : births and immigration add individuals; deaths and emigration remove them. All terms must refer to the same interval. This account uses counts, whereas a per-capita rate is measured per individual per time. An unchanged final total can conceal substantial turnover.
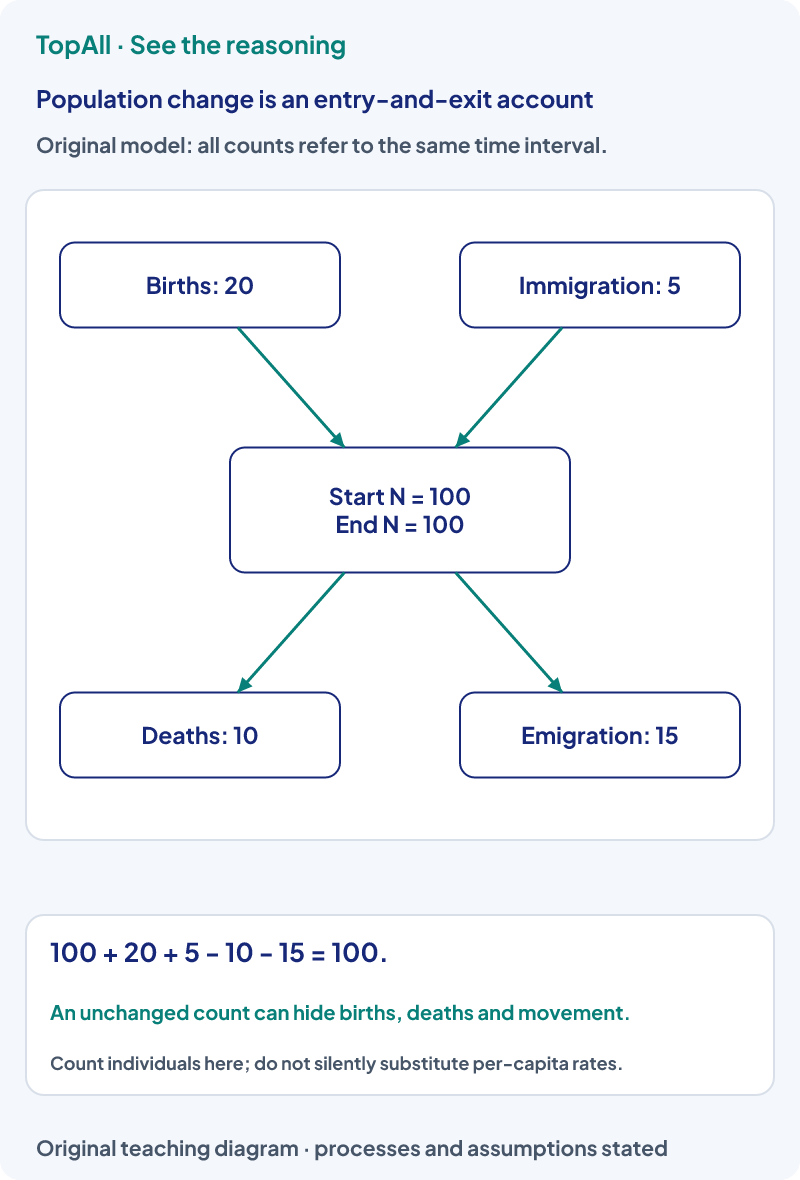
For the illustrated interval, additions are 20 + 5 = 25 and removals are 10 + 15 = 25. Net change is zero and the final count remains 100. Saying there were no births or no migration is unsupported. A second population could reach the same final total through entirely different entry and exit counts.
For the supplied continuous model,
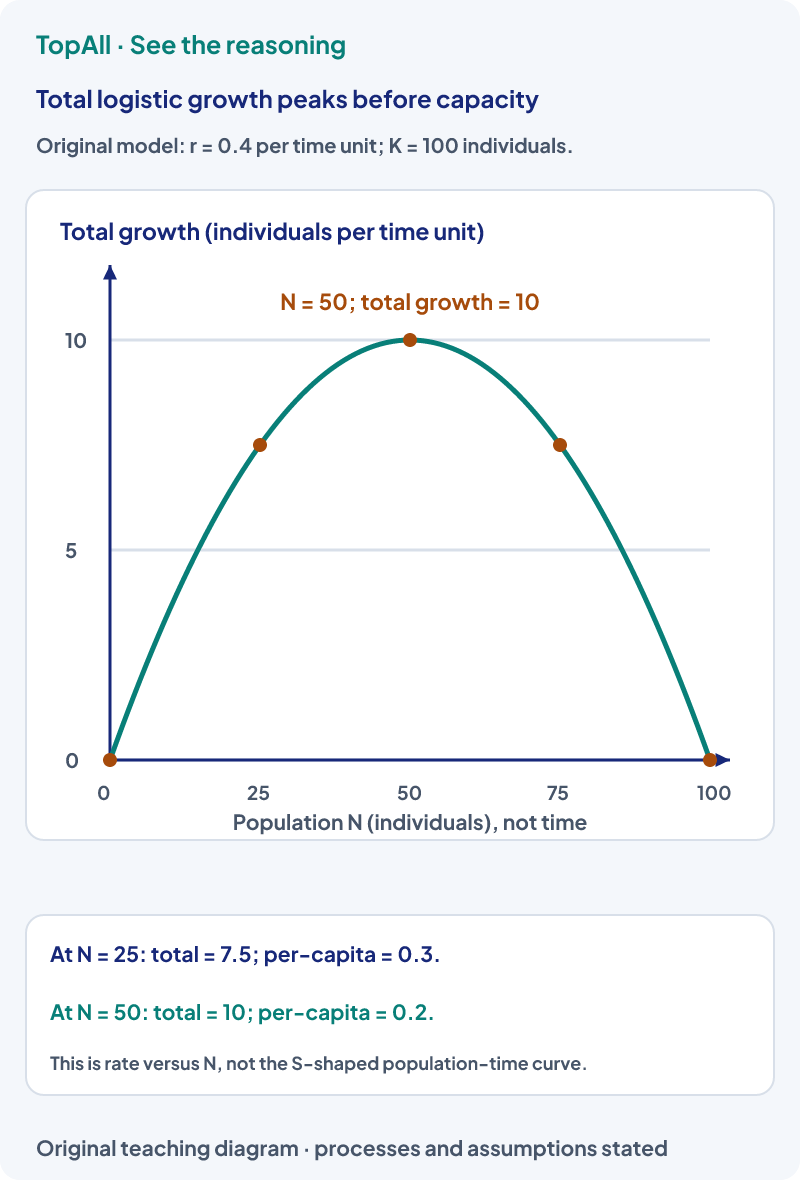
At N = 25, per-capita growth is 0.4 × (1 − 25/100) = 0.3 and total growth is 7.5 individuals per time unit. At N = 50, per-capita growth falls to 0.2 but total growth rises to 10. More individuals can collectively add more even while each has a lower model rate. The total rate reaches its maximum at K/2 for this constant-parameter positive-r model.
At N equal to K, the stated logistic model gives zero net growth. Births and deaths may still occur. Above K, the factor 1 − N/K is negative and the model predicts a decline for positive r. K is tied to the environment and model assumptions, not a permanent species-specific headcount that applies to every habitat.
An original experiment states that organism A gains food while organism B loses resources and has reduced reproductive output. The signs are positive for A and negative for B. That supports a positive/negative interaction, but the signs alone do not distinguish predation from parasitism without the mechanism. If both benefit the signs are positive/positive; if both are harmed they are negative/negative.
A population concerns individuals of one species in the defined place and interval. A community includes interacting populations. An ecosystem also includes abiotic components and their interactions. Competition within one population and competition between species are different scopes. A physiological response by one organism is not automatically a genetic change in the whole population.
Label every input as a count, per-capita rate or total rate. Check the interval, sign and denominator before calculating. In interaction questions, a zero effect means no effect in the stated model, not a claim that no effect could ever be detected under any conditions. Do not infer a named mechanism from one sign alone.
Start with 80 individuals. During one interval there are 12 births, 3 immigrants, 8 deaths and 2 emigrants. What is the final count?
80 + 12 + 3 − 8 − 2 = 85. Additions total 15 and removals 10, so net change is plus 5. Using a percentage or per-capita rate in place of one count would require another conversion and a clearly defined time basis.
For the illustrated logistic model, compare total growth at N = 25 and N = 75. Are their per-capita rates also equal?
Both total rates are 7.5. Per-capita growth differs: 0.3 at 25 and 0.1 at 75. Equal total changes can be spread across different population sizes. Symmetry of the total-rate parabola does not make the per-capita rates symmetric.
Rebuild the entry-and-exit balance, then compare total and per-capita rates at two population sizes. Follow energy accounting in Eco-system, or connect population patterns to Biodiversity and Conservation.
Practice opens the broad chapter pool rather than a logistic-growth-only set.
Technical review: Codex (automated), 24 October 2026. Core mechanisms were compared with the linked primary textbooks and university or government references. All diagrams, problem inputs and explanations are original. Numerical balances and diagram directions are checked separately. Independent human subject review is not claimed. These focused guides support the existing chapter catalogue; they do not claim complete current exam or syllabus coverage.
After an error, write the units, interval and whether the quantity is per individual or for the whole population. Then use chapter practice to check the distinction.

