NEET UG · Video

Fossils and Embryology Evidence
Study fossils and embryology as evidence for evolution for NEET UG with TopAll.
5 min video

NEET UG · Biology
Revise the concepts. Try a question. Understand your next step.
110 easy questions available · Try answers free. Sign in to save progress or take a quiz.
NEET UG · Biology
Understand the concept, practise questions and check your learning.
Understand
Calculate allele and genotype frequencies with explicit assumptions and explain how survival and reproductive contribution change a model population. Evolution: distinguish allele counts, equilibrium and selection
Read the guidePractise
Try 110 easy chapter MCQs. Untimed; check answers and available explanations as you go.
Practise chapter MCQsCheck your learning
Prepare a timed chapter quiz. Choose the available question count and pace before starting.
Prepare a chapter quizThis is chapter practice, not a full-length NEET mock paper.
These are playable question counts after quality and duplicate checks.
The practice player uses single-correct-answer MCQs. Chapter quizzes are not full-length NEET mock papers. Check the practice guide and official syllabus sources.
Revise before you practise
NEET UG · Video
Study fossils and embryology as evidence for evolution for NEET UG with TopAll.
5 min video
NEET UG · Video
Study origin and evolution of man clearly for NEET UG with TopAll.
5 min video
NEET UG · Video
Revise a brief account of evolution with exam focus for NEET UG with TopAll.
6 min video
NEET UG · PDF notes
Read PDF · 11 pages →Study origin and evolution of man clearly for NEET UG with TopAll.
11 pages
NEET UG · PDF notes
Read PDF · 10 pages →Revise a brief account of evolution with exam focus for NEET UG with TopAll.
10 pages
NEET UG · PDF notes
Read PDF · 10 pages →Understand the Hardy-Weinberg principle for NEET UG with TopAll.
10 pages
NEET UG · Mind map
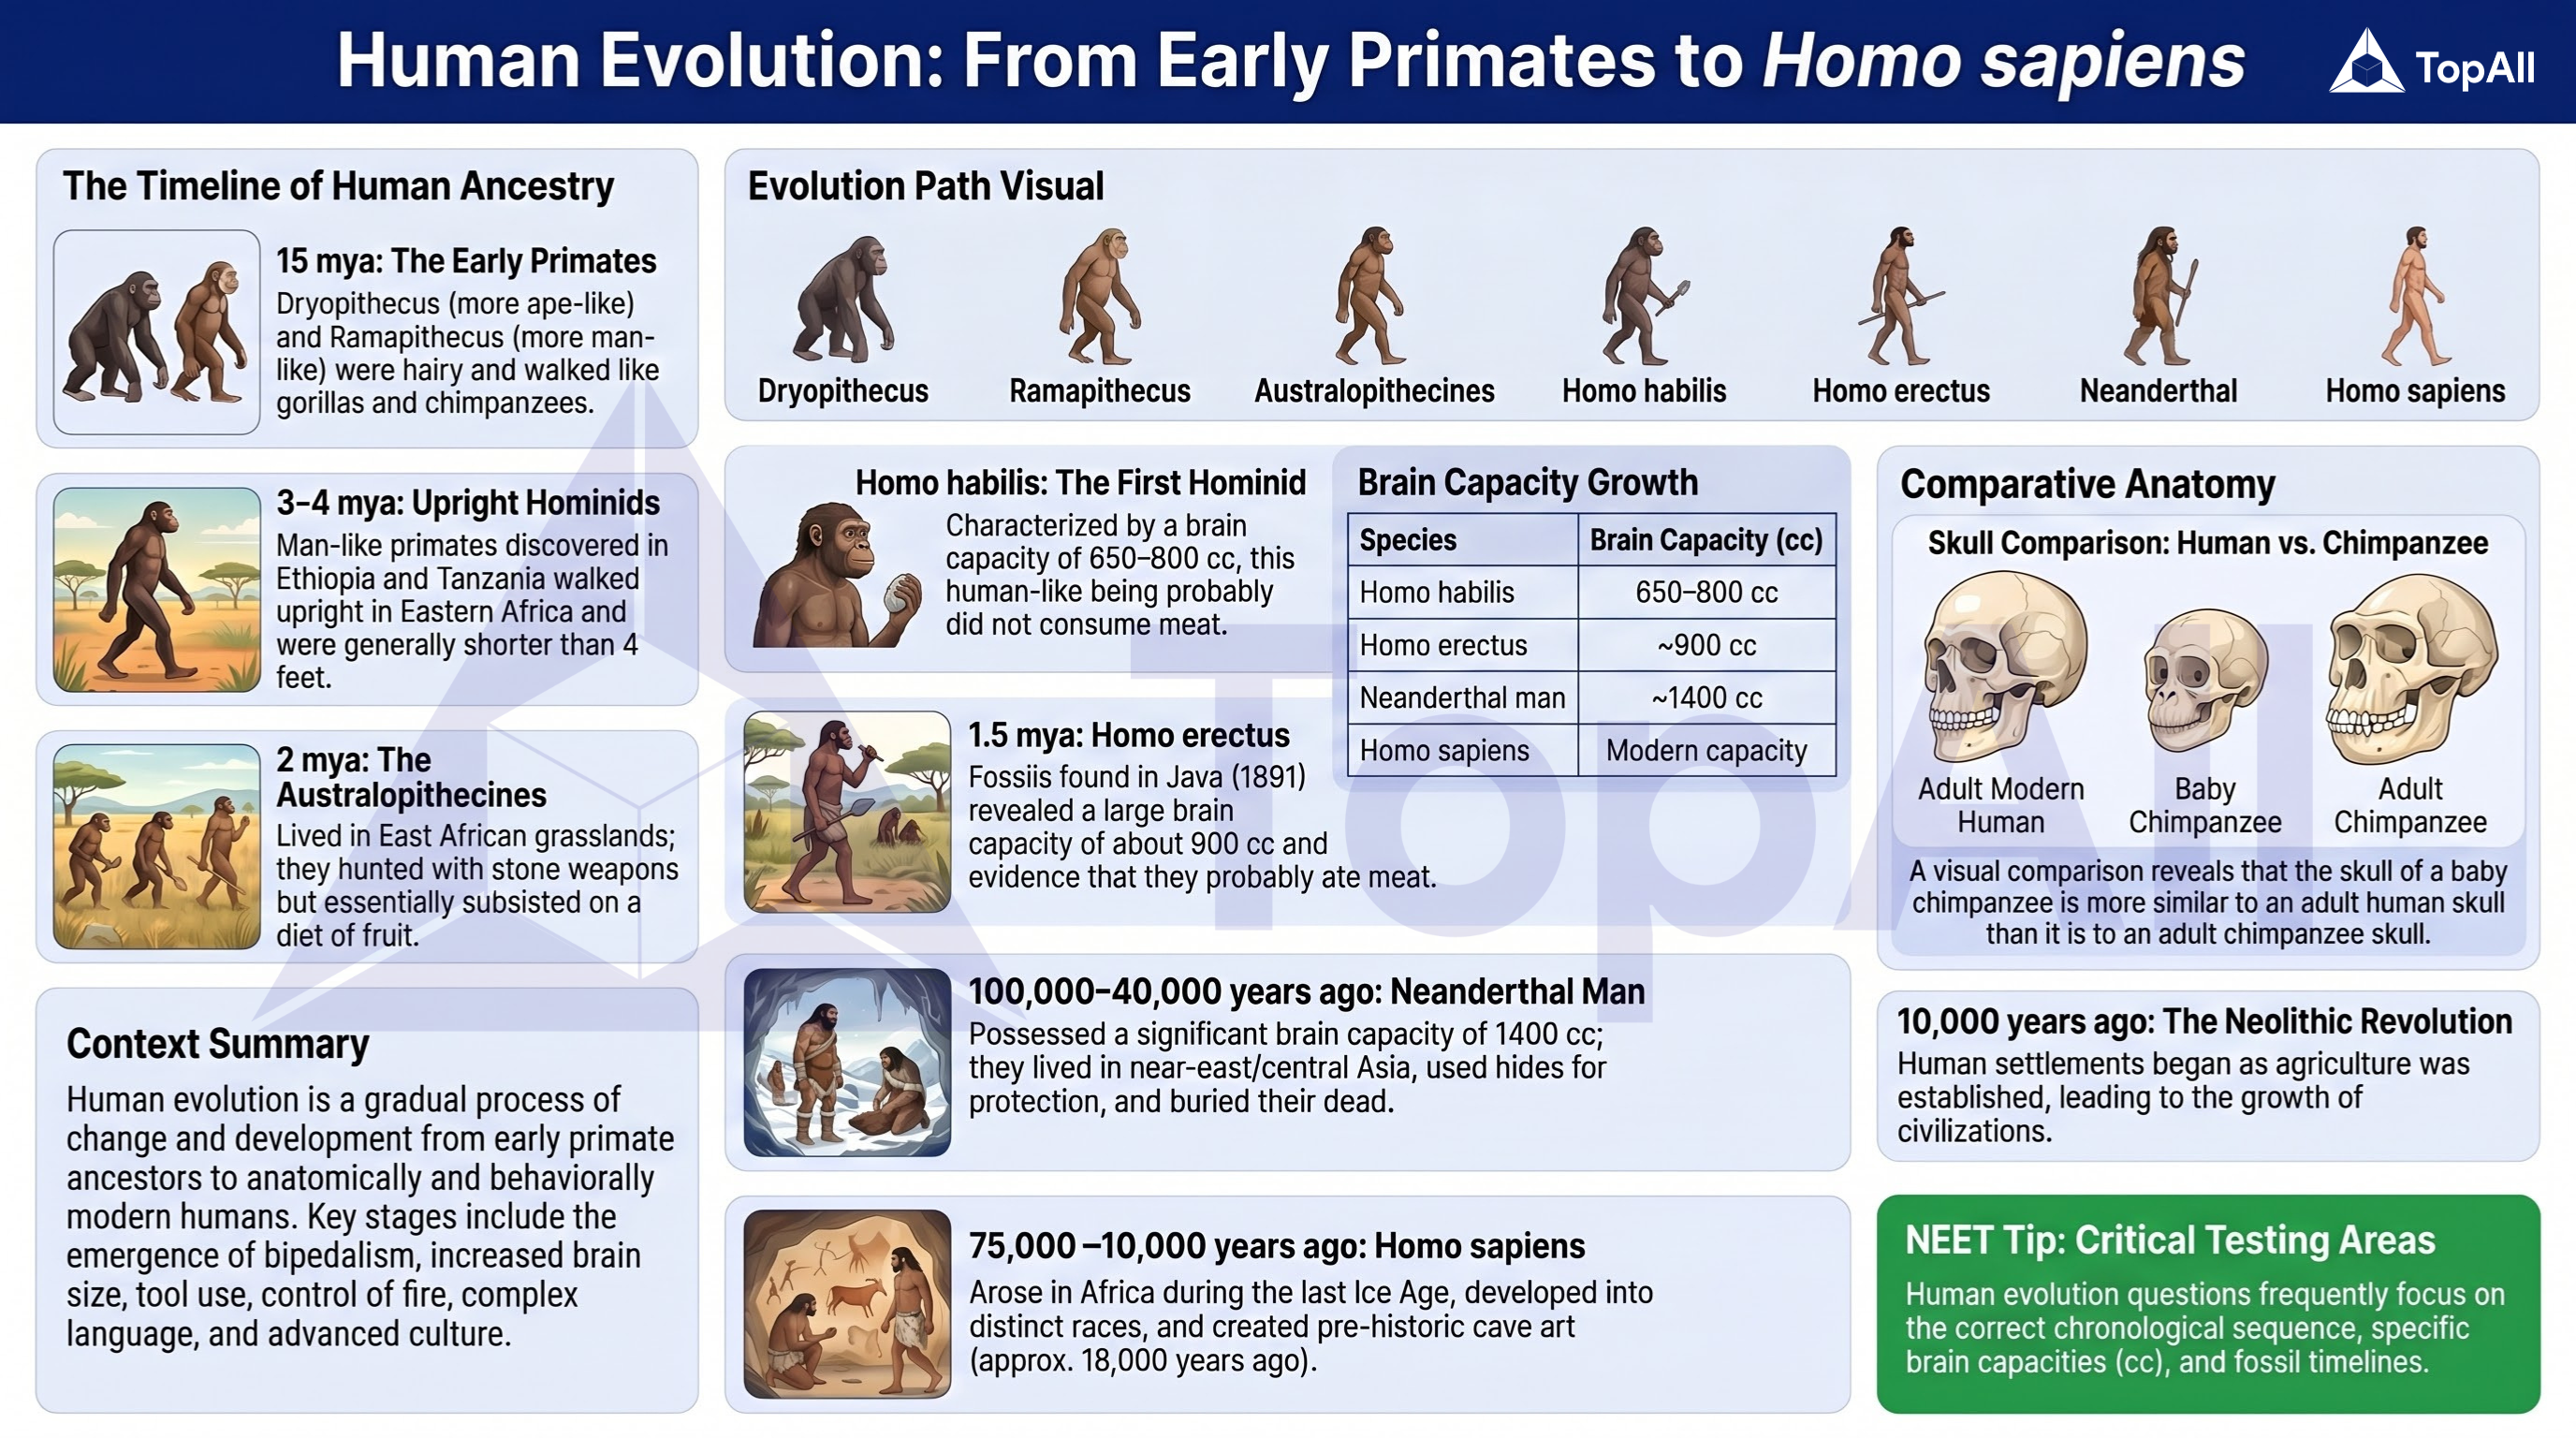
Study origin and evolution of man clearly for NEET UG with TopAll.
NEET UG · Mind map
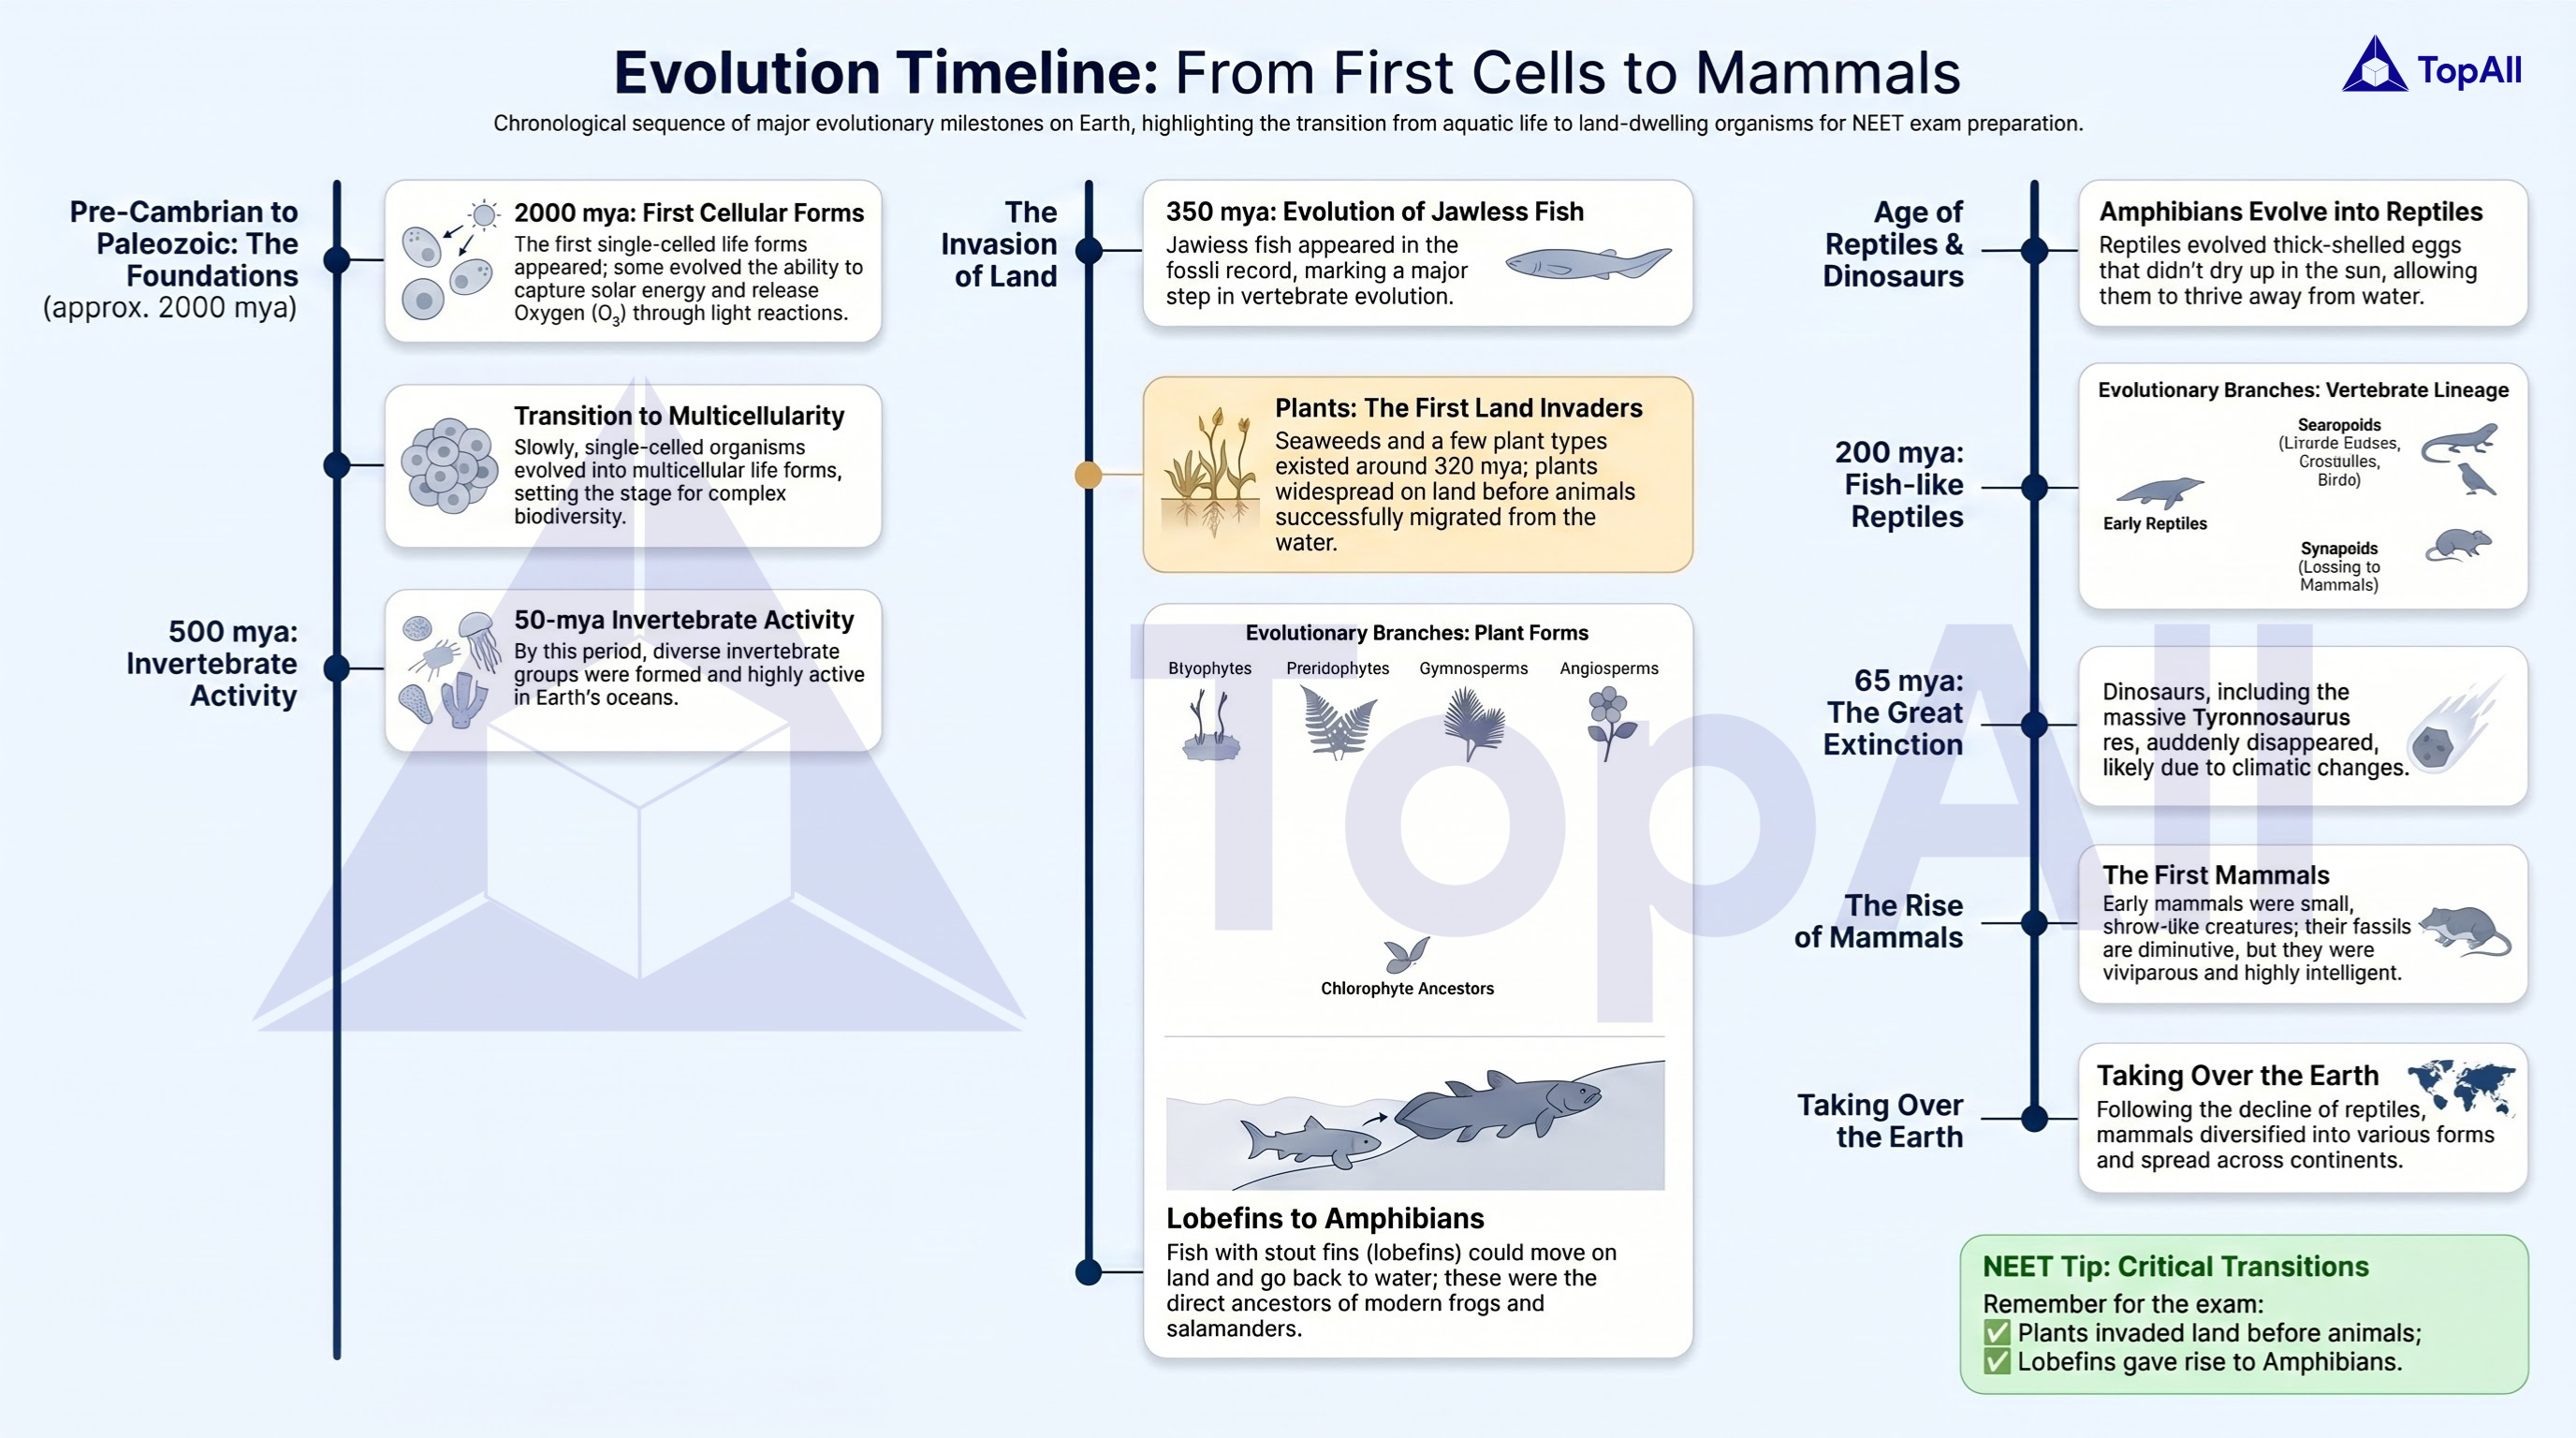
Revise a brief account of evolution with exam focus for NEET UG with TopAll.
NEET UG · Mind map
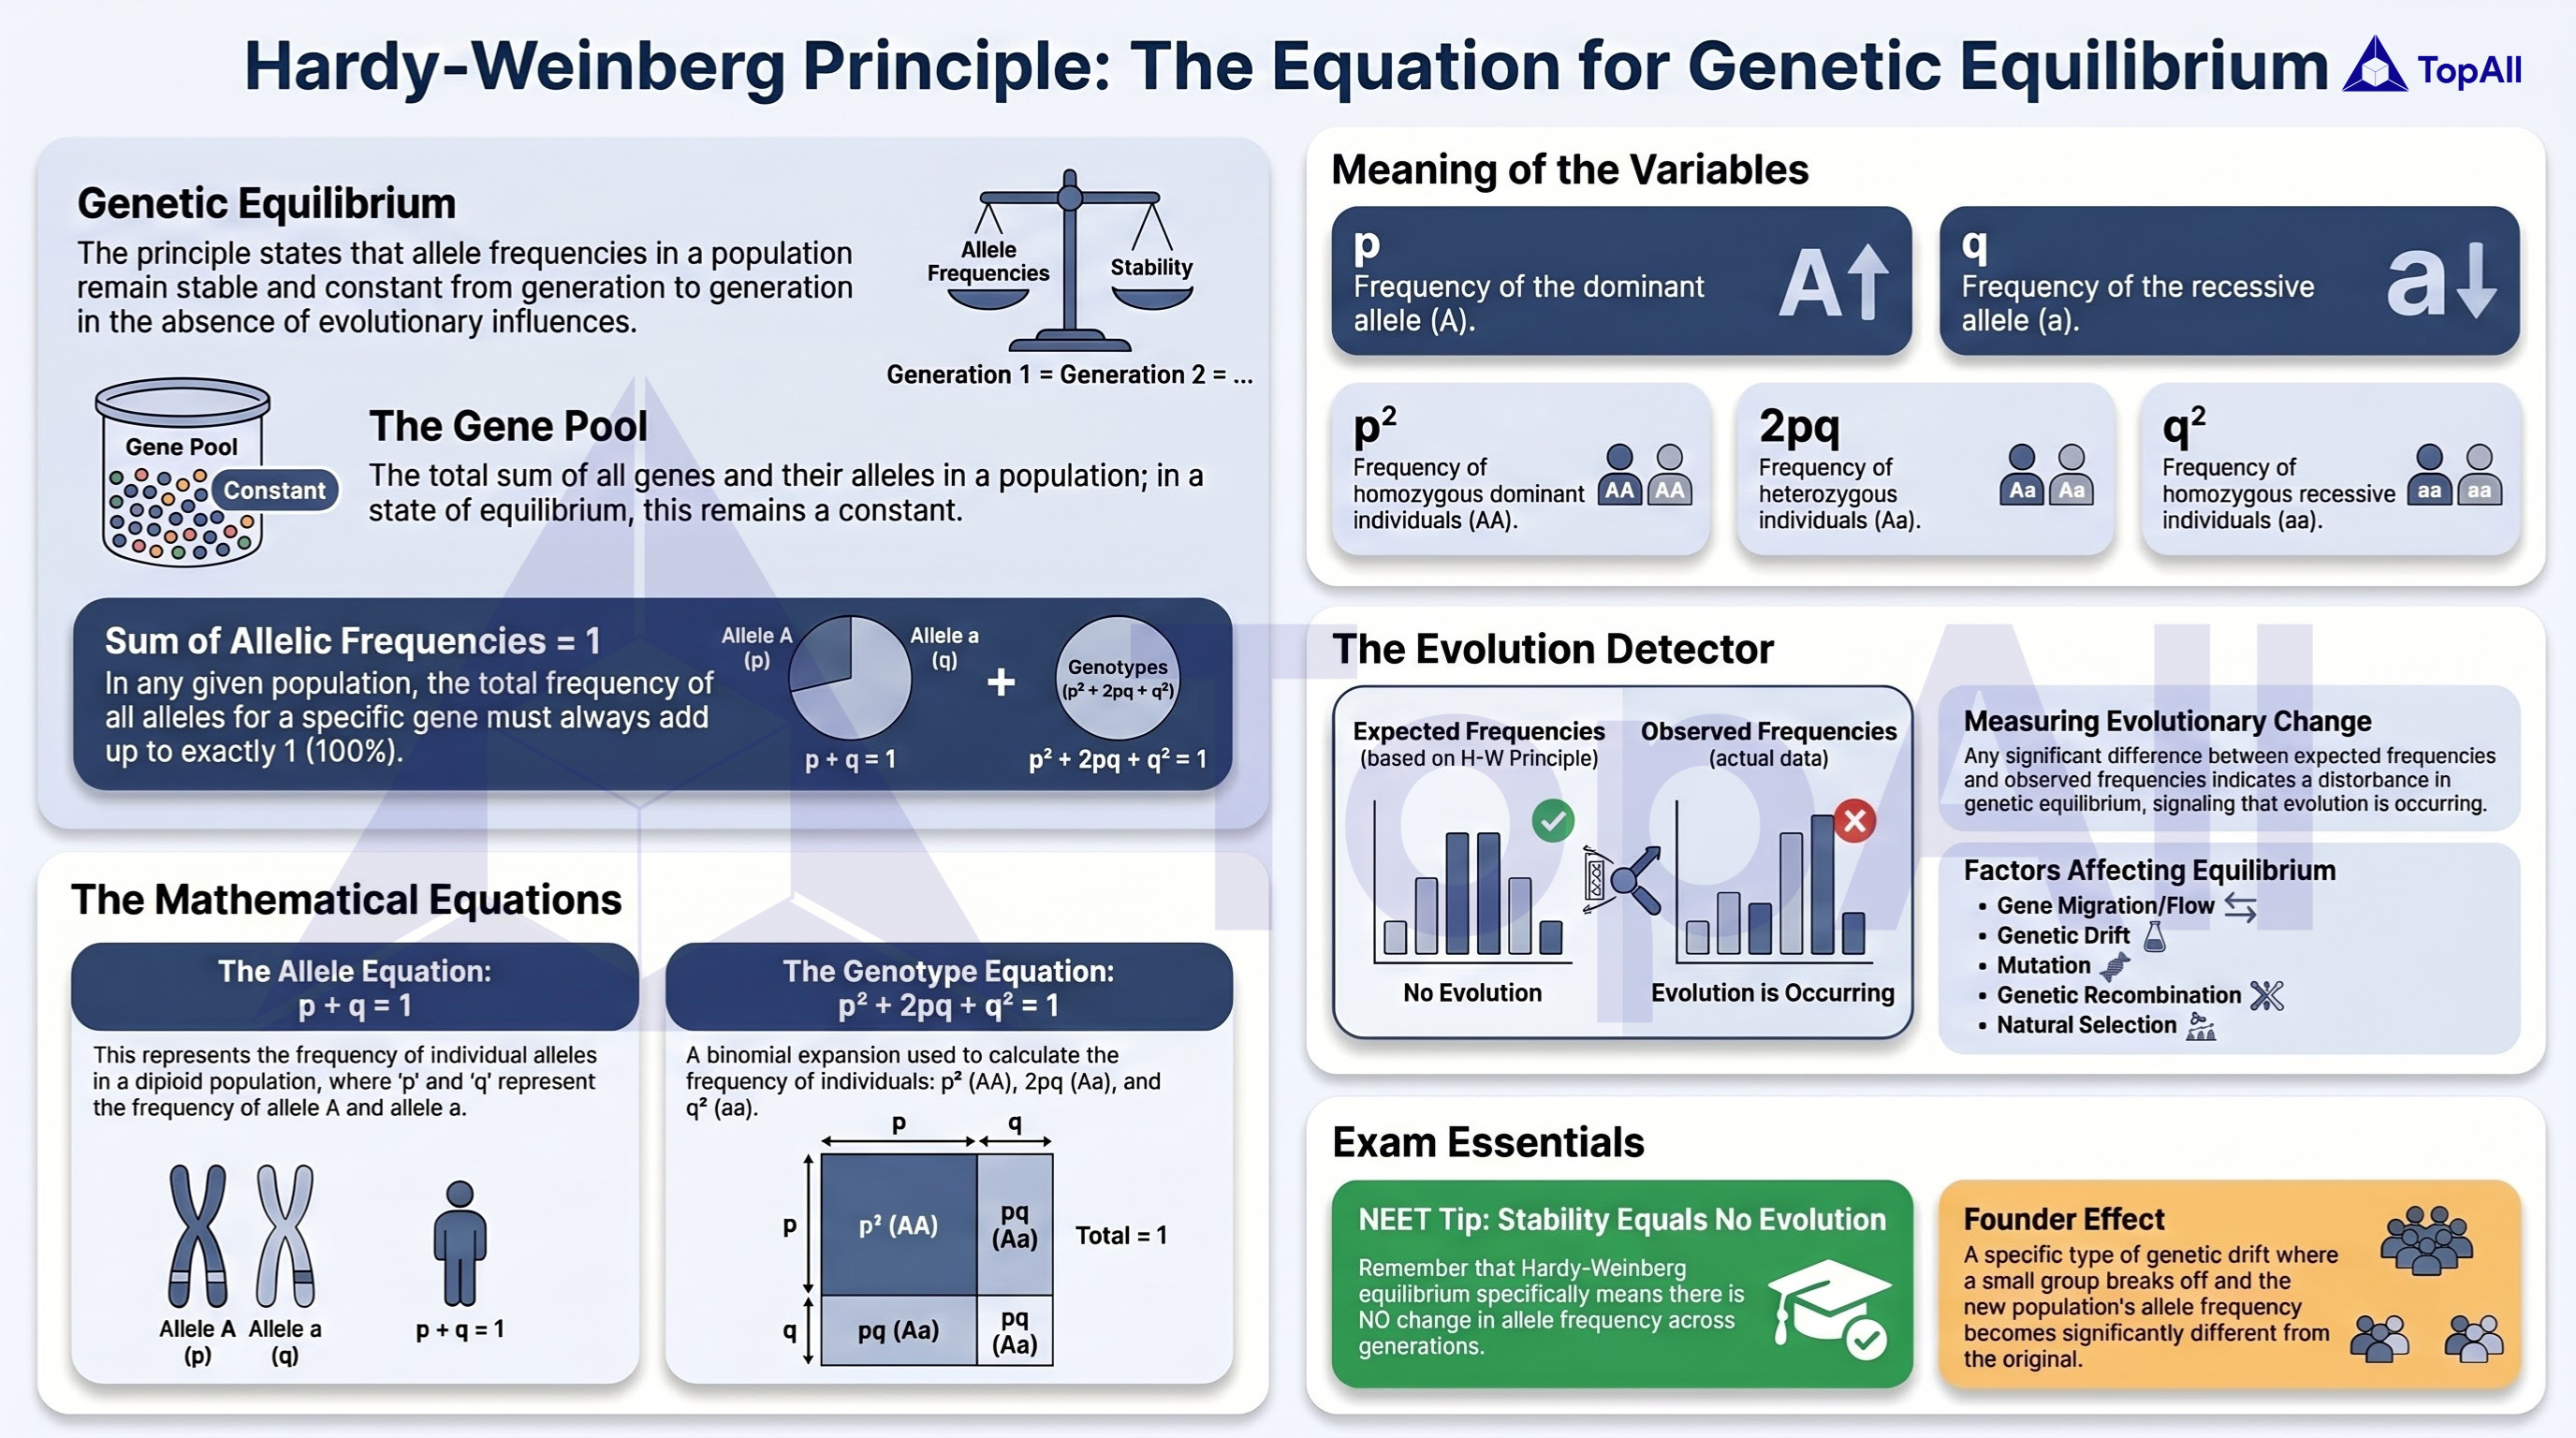
Understand the Hardy-Weinberg principle for NEET UG with TopAll.
Calculate allele and genotype frequencies with explicit assumptions and explain how survival and reproductive contribution change a model population.
For NEET UG Biology students: count alleles separately from genotypes, use Hardy-Weinberg as a stated model and connect heritable variation to survival and reproductive contribution.
Population genetics tracks allele and genotype frequencies. A standard diploid individual has its own genotype; it does not change into the population’s new frequency. Hardy-Weinberg gives a comparison model under random mating and no mutation, migration, selection or drift in the ideal large-population setting. Departures need investigation rather than an automatic claim that one particular force caused them.
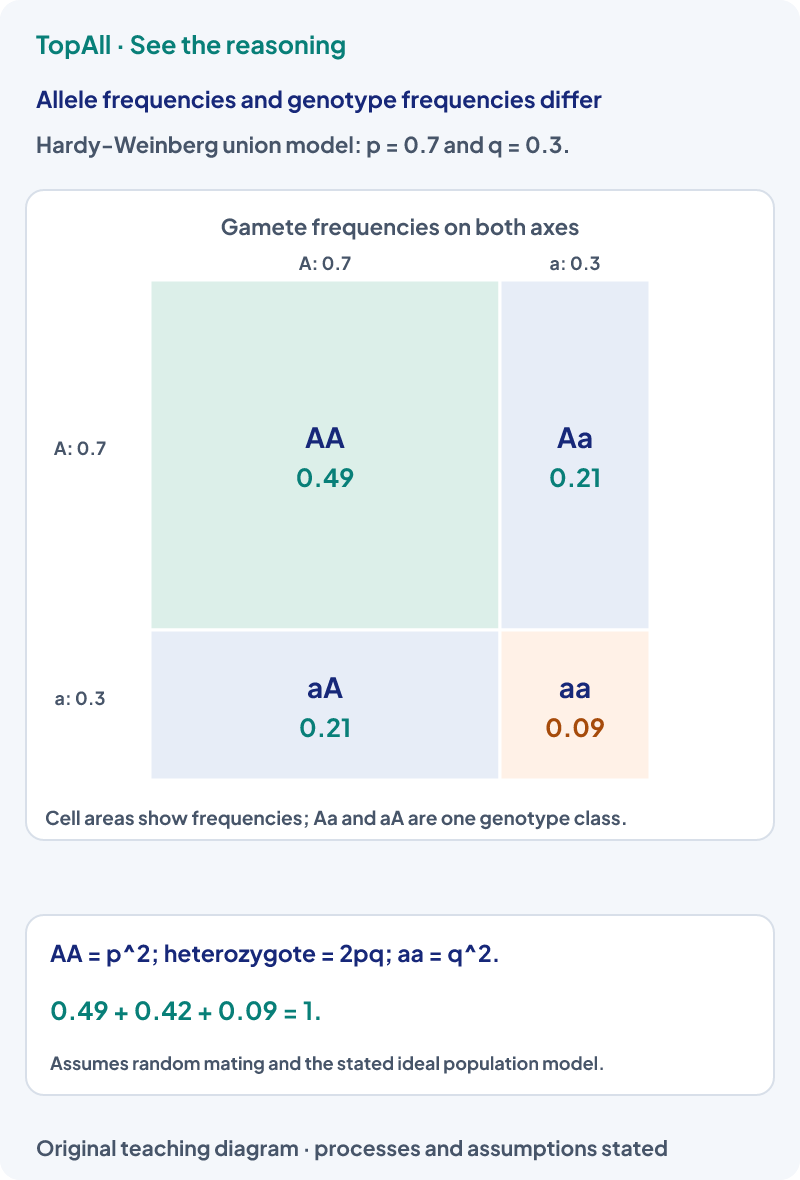
In a stated Hardy-Weinberg model with complete recessive expression, 9% of individuals have phenotype aa. Here , so q = 0.3 and p = 0.7. Heterozygote frequency is 2pq = 0.42, not 0.09 and not 0.3. The inference depends on the model and on the phenotype correctly identifying aa; a phenotype proportion alone is not always an allele-frequency estimate.
For a sample of diploid autosomal genotypes, count two A copies from AA and one from Aa, then divide by twice the number of individuals. This estimates the sample allele frequency even if genotype proportions do not match equilibrium expectations. The frequency equation and the equilibrium prediction answer different questions: one counts observations, while the other predicts under assumptions.
An original sample contains 40 AA, 40 Aa and 20 aa individuals.
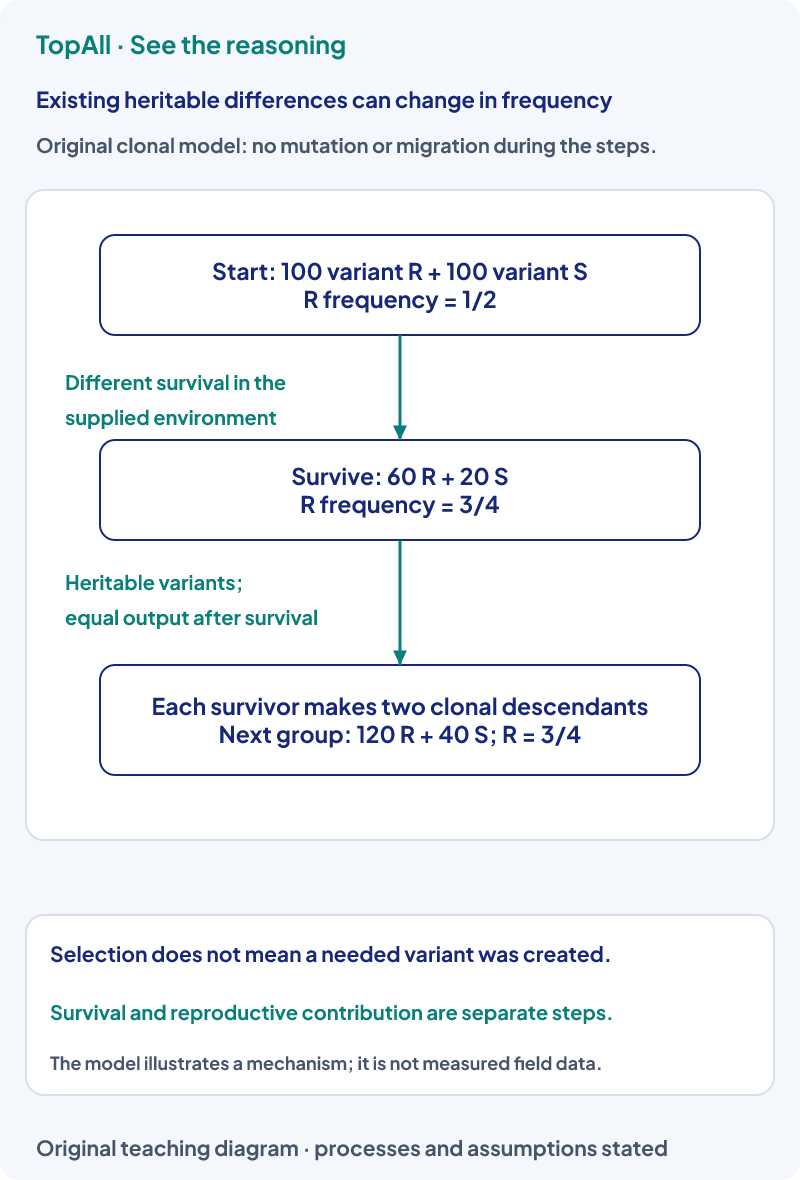
A variant can contribute more descendants in one environment without being universally superior. Mutation supplies new genetic variants; selection can change how existing heritable differences contribute to later generations. Genetic drift can also change frequencies through chance, especially in small populations. A frequency shift is therefore not evidence that organisms produced a needed mutation because they tried to adapt.
In the illustrated model, R survival is 60/100 = 60%, while S survival is 20%. Among the eighty survivors, however, R frequency is 60/80 = 75%. The 60% survival rate and 75% survivor composition have different denominators. Equal clonal output after survival preserves the 75% composition in the next group; it does not create another increase merely because reproduction occurred.
For two alleles, is the frequency total. Under the stated equilibrium model, describes genotype proportions. The first identity does not itself establish equilibrium. Dominance affects phenotype mapping, while the genotype-frequency calculation depends on the mating and population assumptions.
Ask whether the numerator counts allele copies, genotypes, survivors or descendants. State the total used for each fraction. A recessive phenotype can support a square-root inference only in the appropriate model. Do not label every change natural selection without evidence about heritable differences and differential contribution.
A stated Hardy-Weinberg two-allele model has aa frequency 0.16. Find q, p and the expected Aa frequency.
q is the square root of 0.16, or 0.4; p is 0.6. The expected Aa frequency is 2 × 0.6 × 0.4 = 0.48. The 0.16 is a genotype frequency, while 0.4 is an allele frequency. These values follow the supplied equilibrium assumptions.
A small isolated population changes allele frequency between generations, but no survival or reproductive advantage has been demonstrated. Does the frequency change alone prove natural selection?
No. Chance sampling and drift, among other possibilities depending on the conditions, can change frequencies. Evidence about differential reproductive contribution associated with heritable traits is needed to support a selection explanation. A change and its cause are different claims.
Count A copies in a genotype sample without assuming equilibrium, then calculate equilibrium expectations as a separate step. Revisit crosses in Inheritance and Variation, or connect target-specific effects to Biotechnology Applications.
The practice action opens the broad evolution chapter pool, not a Hardy-Weinberg-only set.
Technical review: Codex (automated), 24 October 2026. Core mechanisms were compared with the linked primary textbooks and university or government references. All diagrams, problem inputs and explanations are original. Numerical balances and diagram directions are checked separately. Independent human subject review is not claimed. These focused guides support the existing chapter catalogue; they do not claim complete current exam or syllabus coverage.
For a numerical error, name the numerator and denominator. For a mechanism error, separate observed frequency change from evidence about why it occurred.

