NEET UG · Video

The Evil Quartet NEET Biology Guide
Master the Evil Quartet causes of biodiversity loss for NEET UG with TopAll.
6 min video

NEET UG · Biology
Revise the concepts. Try a question. Understand your next step.
24 easy questions available · Try answers free. Sign in to save progress or take a quiz.
NEET UG · Biology
Understand the concept, practise questions and check your learning.
Understand
Compare richness and evenness, interpret a species-area model and distinguish in-situ from ex-situ conservation. Biodiversity: distinguish richness, scaling and conservation actions
Read the guidePractise
Try 24 easy chapter MCQs. Untimed; check answers and available explanations as you go.
Practise chapter MCQsCheck your learning
Prepare a timed chapter quiz. Choose the available question count and pace before starting.
Prepare a chapter quizThis is chapter practice, not a full-length NEET mock paper.
These are playable question counts after quality and duplicate checks.
The practice player uses single-correct-answer MCQs. Chapter quizzes are not full-length NEET mock papers. Check the practice guide and official syllabus sources.
Revise before you practise
NEET UG · Video
Master the Evil Quartet causes of biodiversity loss for NEET UG with TopAll.
6 min video
NEET UG · Video
Learn species-area relationship and biodiversity trends for NEET UG with TopAll.
4 min video
NEET UG · Video
Understand the Rivet Popper Hypothesis in ecology for NEET UG with TopAll.
4 min video
NEET UG · PDF notes
Read PDF · 10 pages →Master the Evil Quartet causes of biodiversity loss for NEET UG with TopAll.
10 pages
NEET UG · PDF notes
Read PDF · 10 pages →Learn species-area relationship and biodiversity trends for NEET UG with TopAll.
10 pages
NEET UG · PDF notes
Read PDF · 8 pages →Understand the Rivet Popper Hypothesis in ecology for NEET UG with TopAll.
8 pages
NEET UG · Mind map
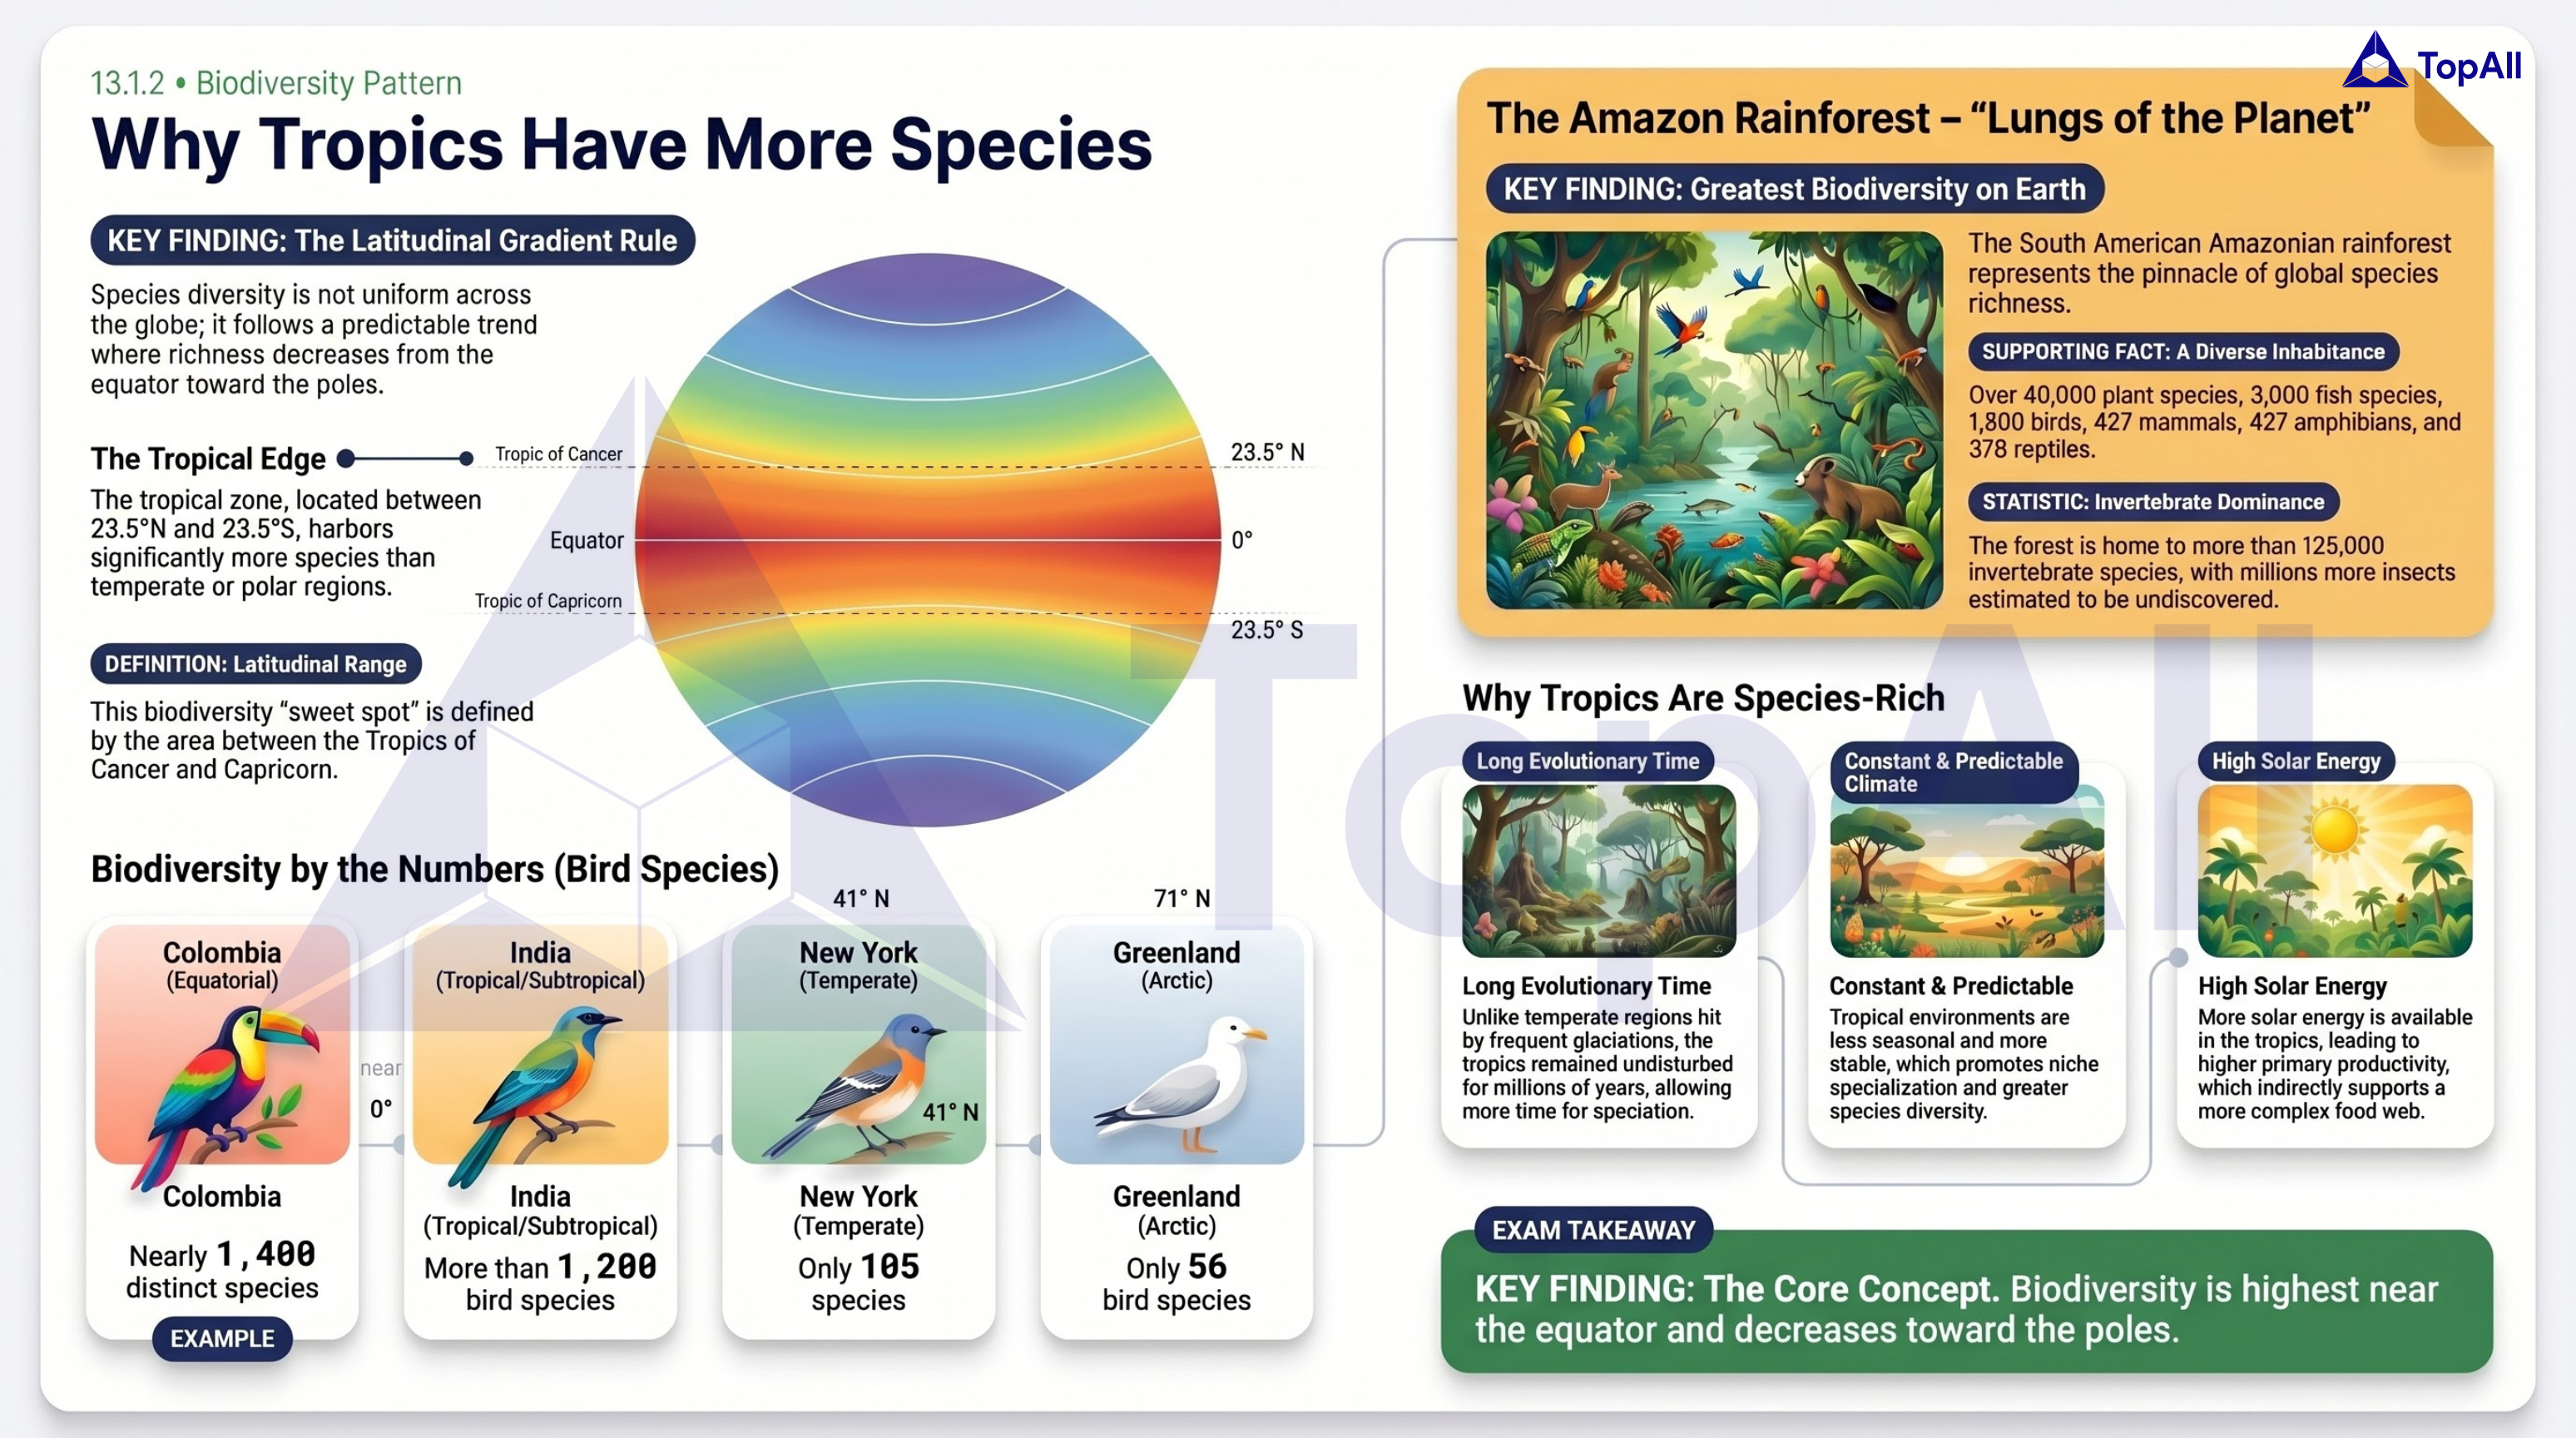
Learn latitudinal gradients in biodiversity simply for NEET UG with TopAll.
NEET UG · Mind map
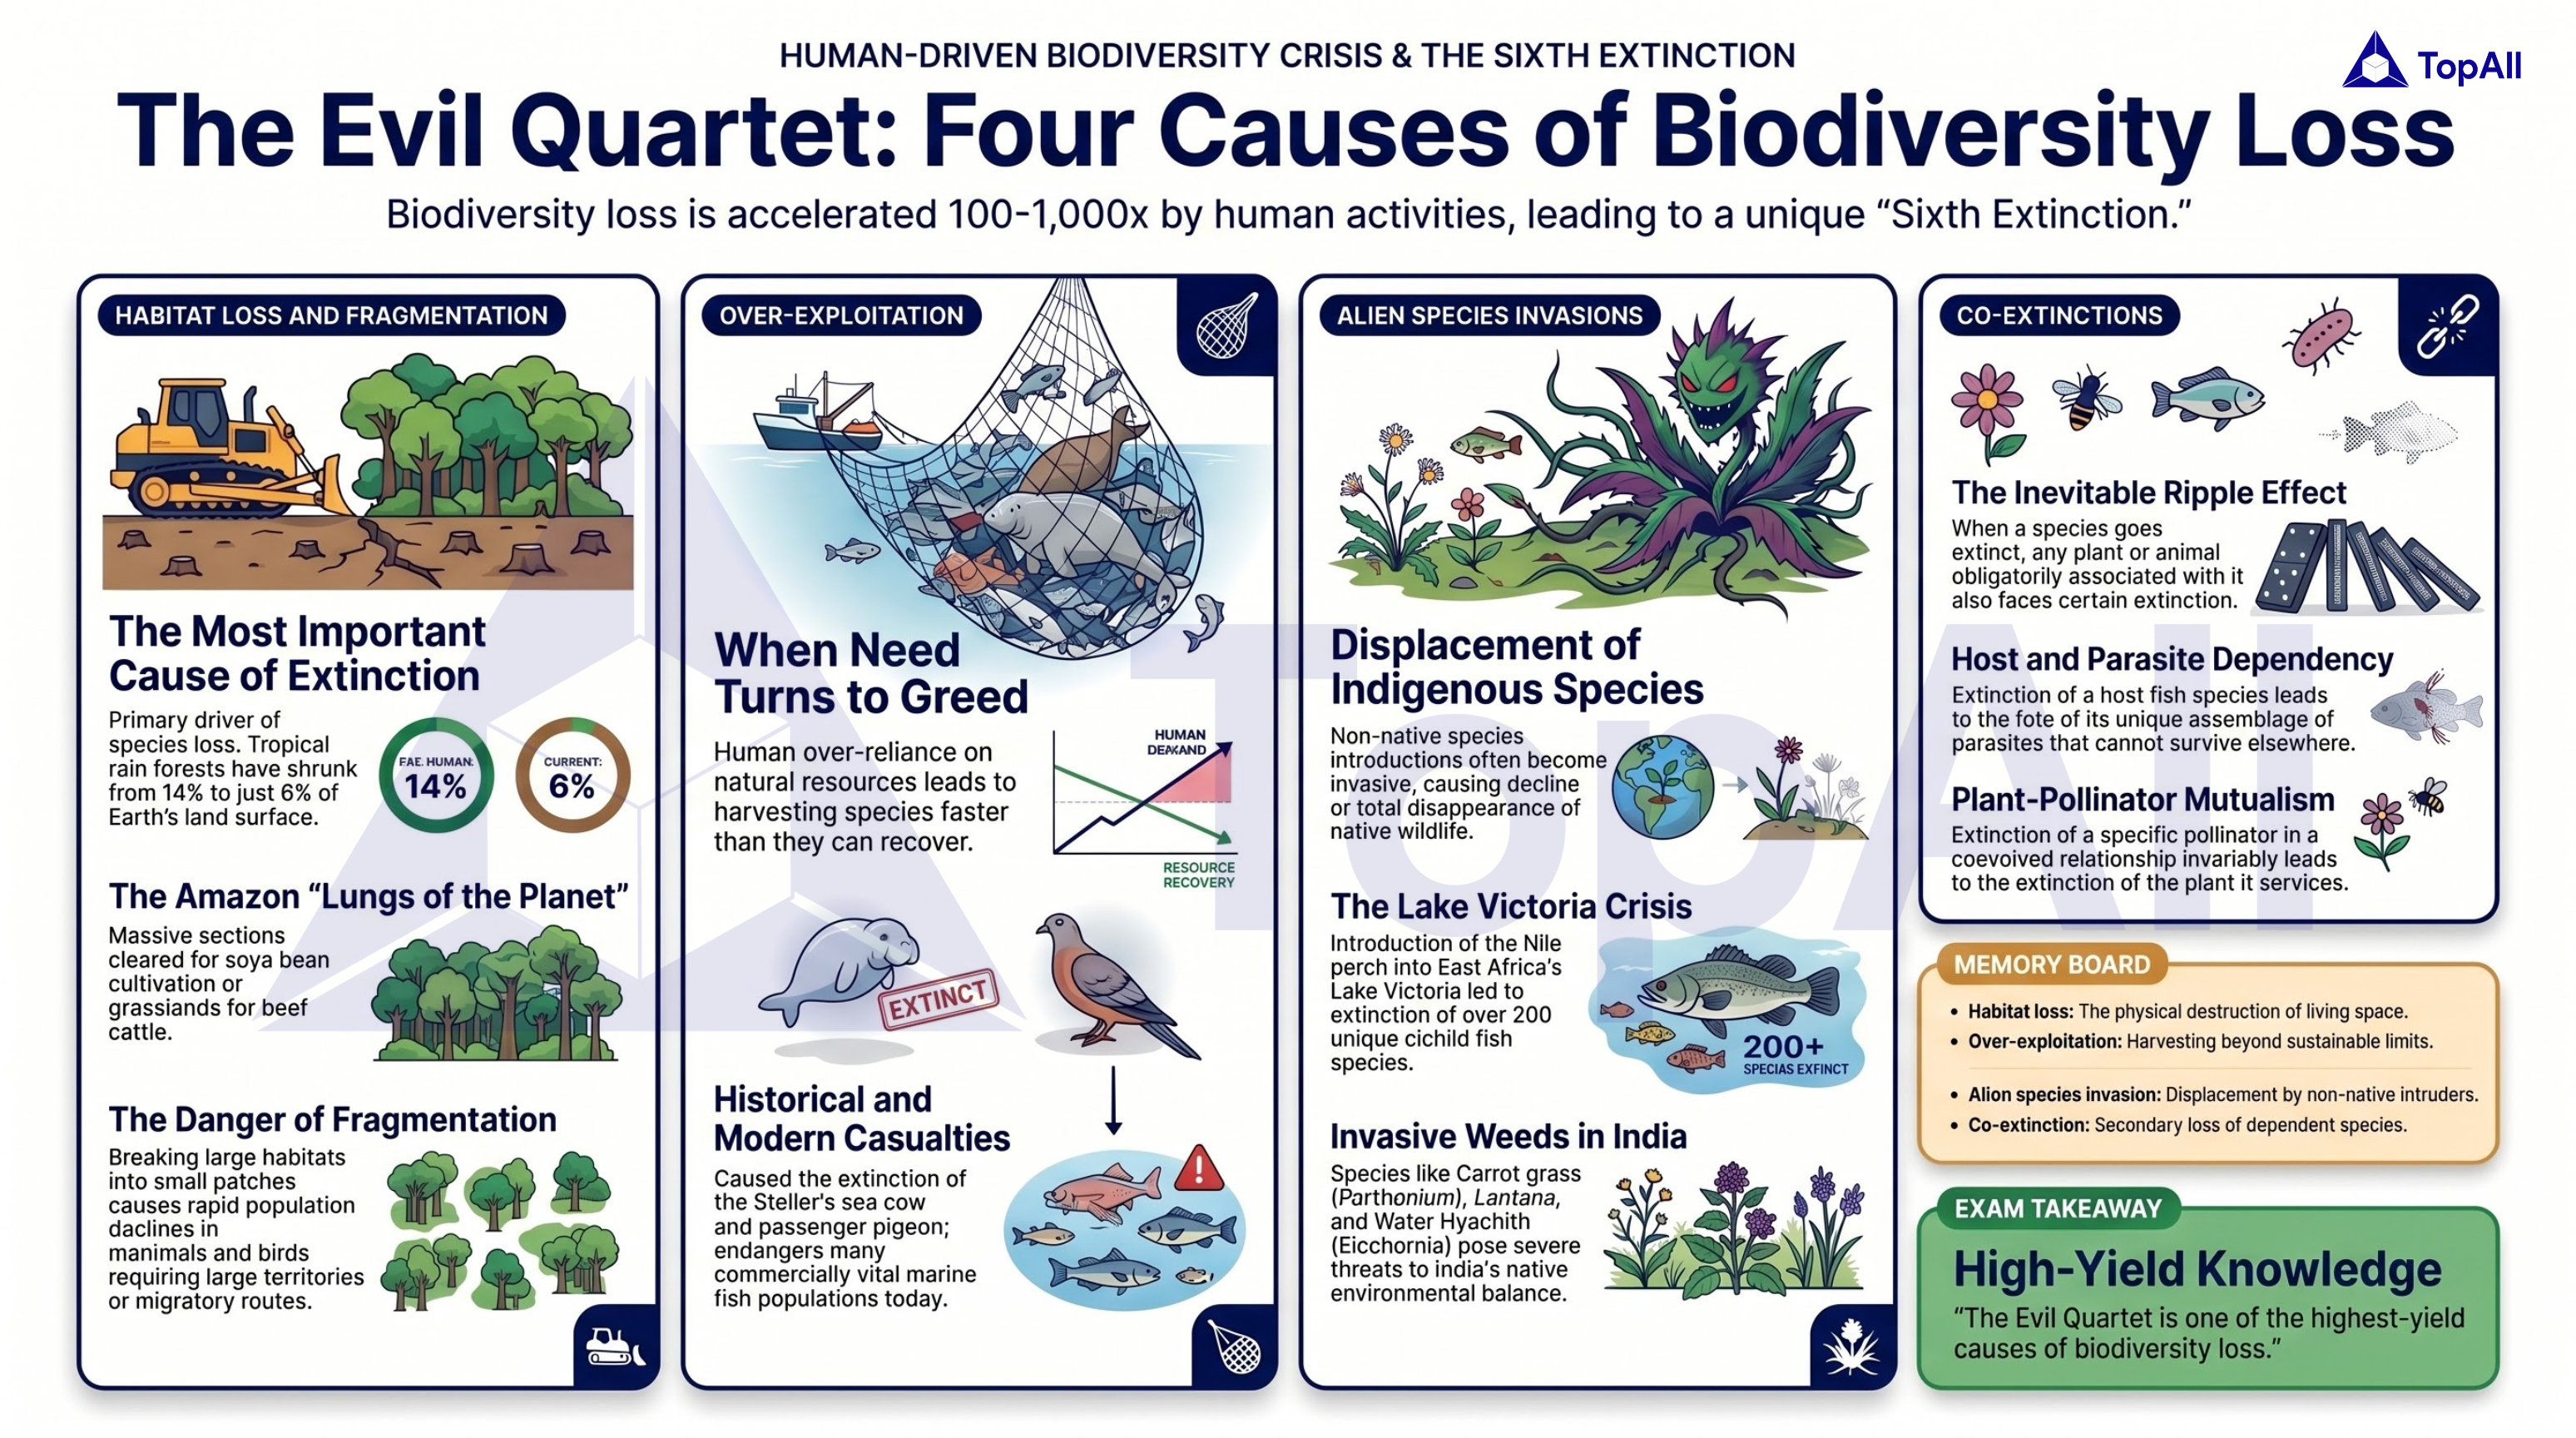
Study Causes Of Biodiversity Loss The Evil Quartet for NEET UG. Free practice, video lectures, PDFs and mind-maps
NEET UG · Mind map
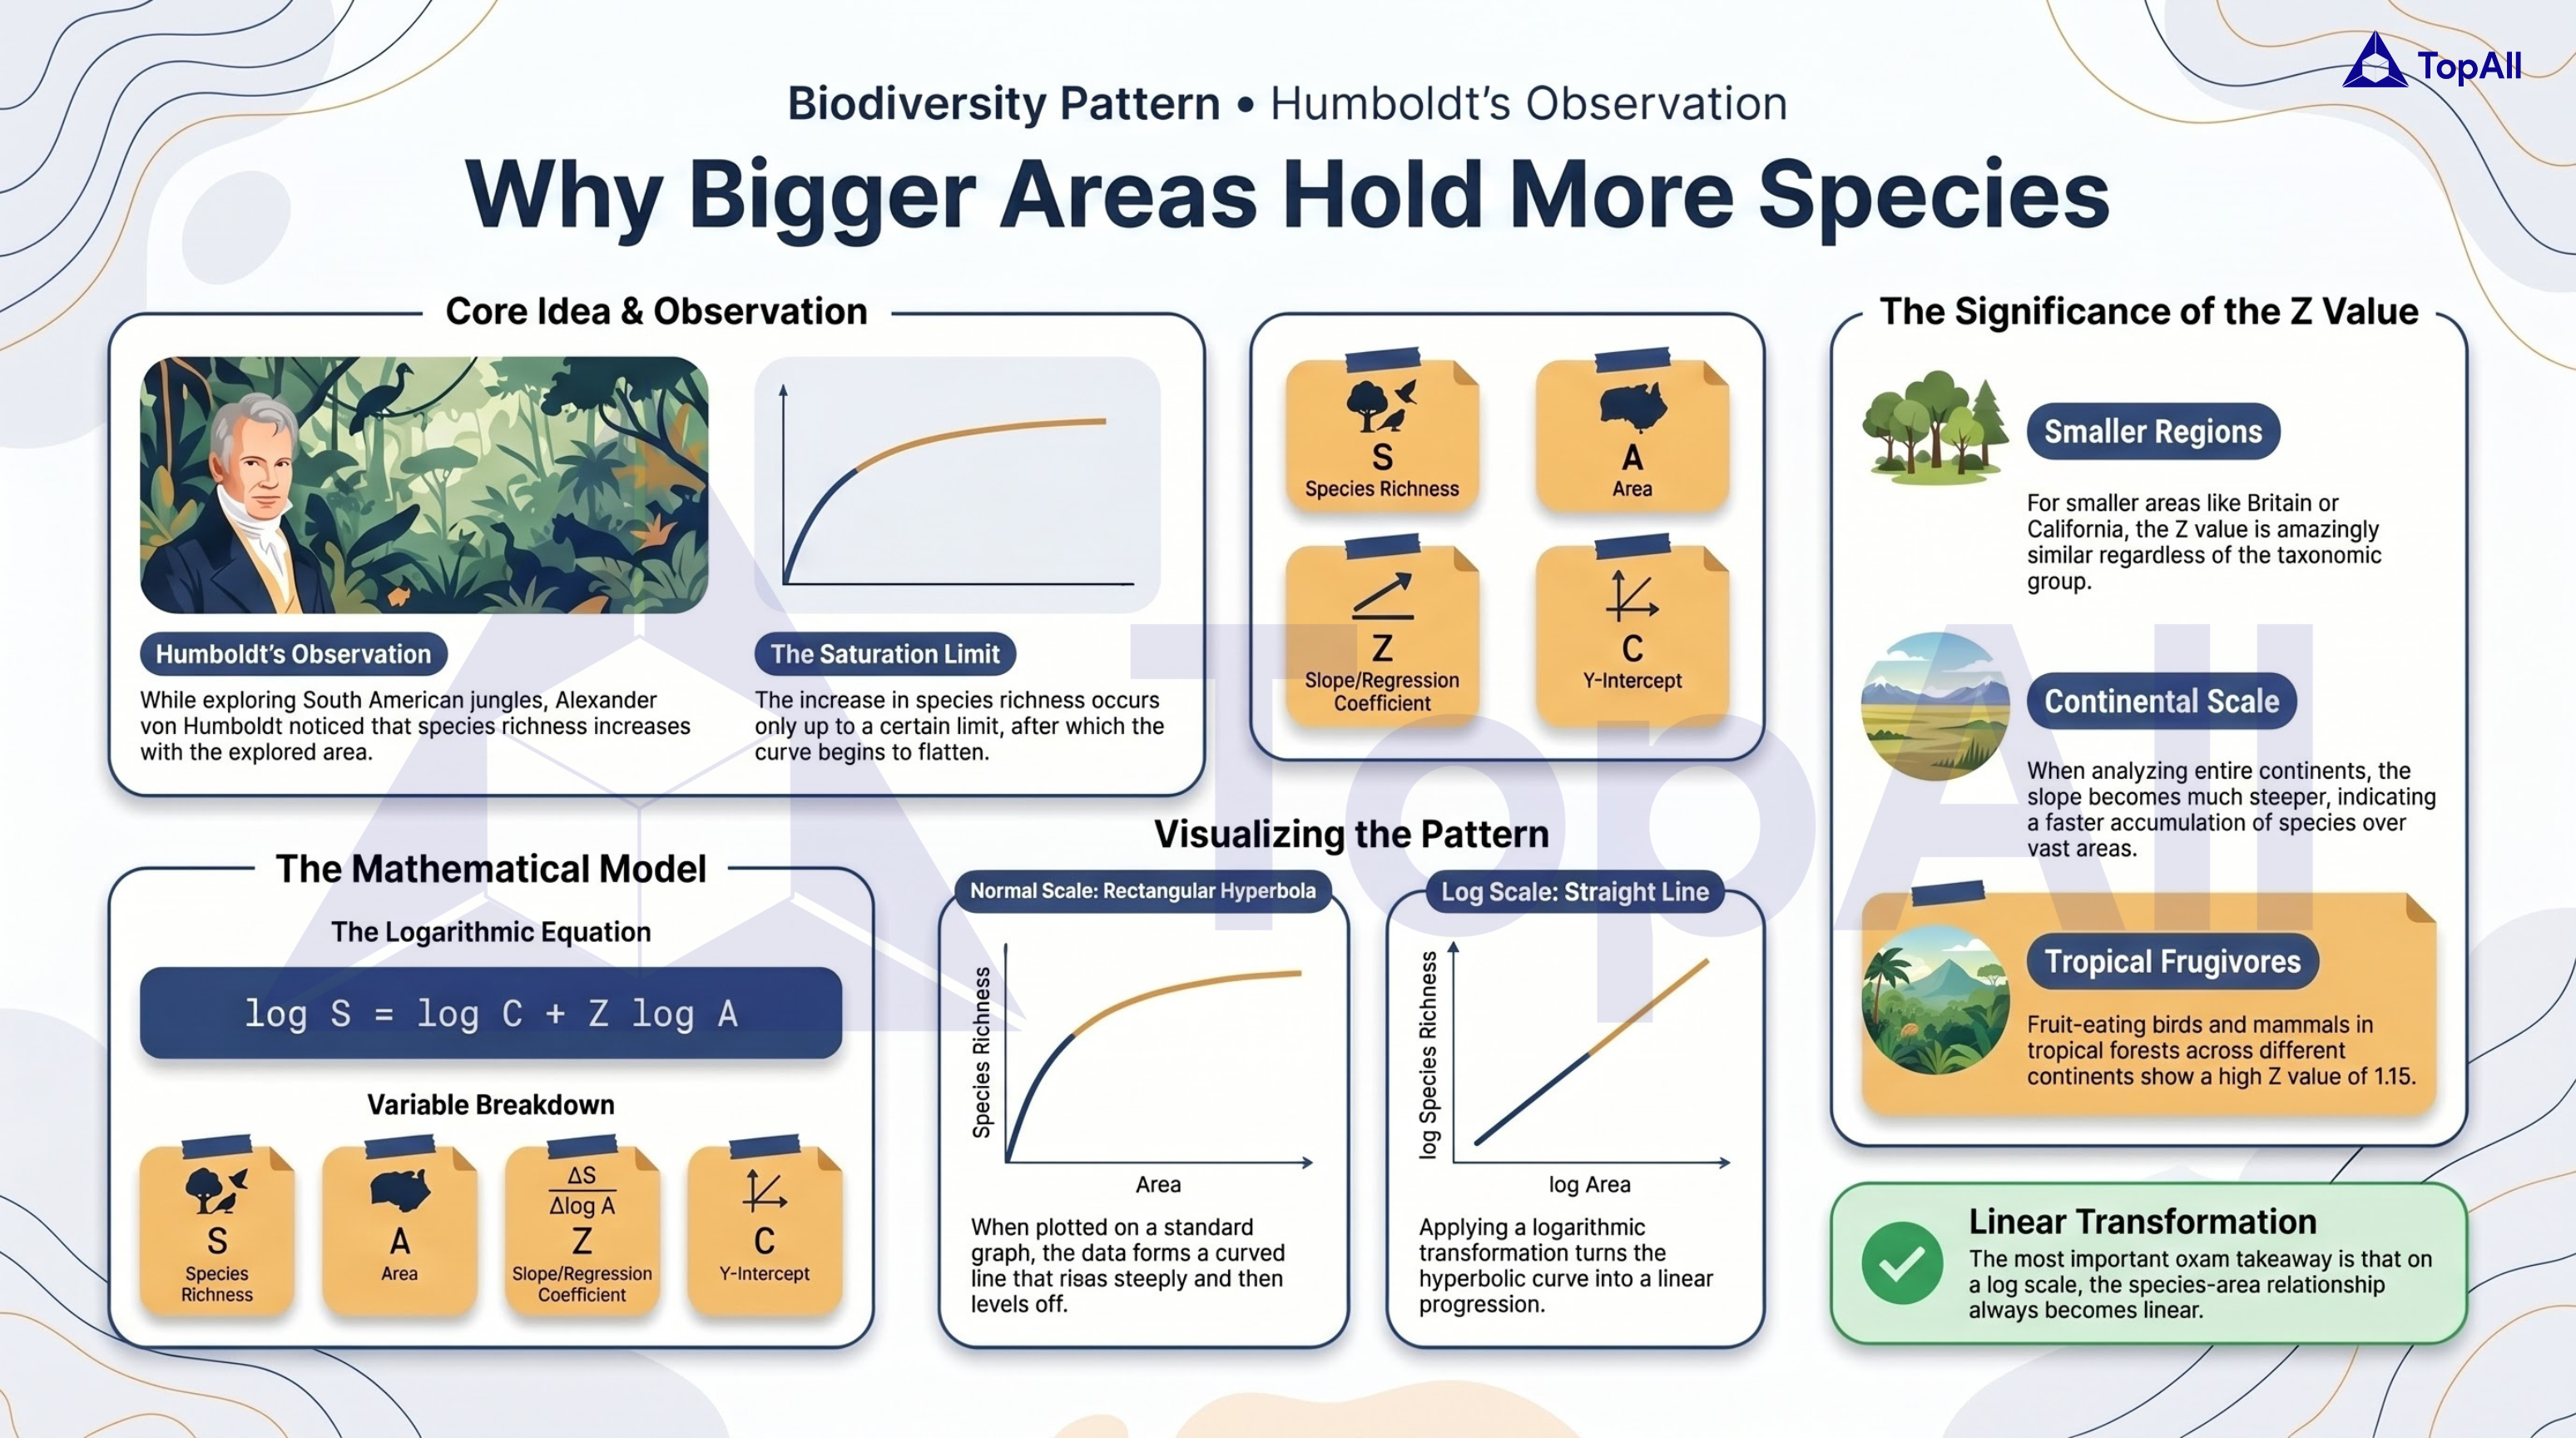
Learn species-area relationship and biodiversity trends for NEET UG with TopAll.
Compare richness and evenness, interpret a species-area model and distinguish in-situ from ex-situ conservation.
For NEET UG Biology students: separate richness from abundance, read a species-area model on logarithmic axes and distinguish habitat conservation from offsite conservation.
Species richness counts the species in the defined sample. Relative abundance describes how individuals are distributed among them. Genetic diversity within a species and diversity among ecosystems are other levels. Two sites with equal species counts need not have equal abundance patterns. Sampling effort and the area examined matter before making a comparison.
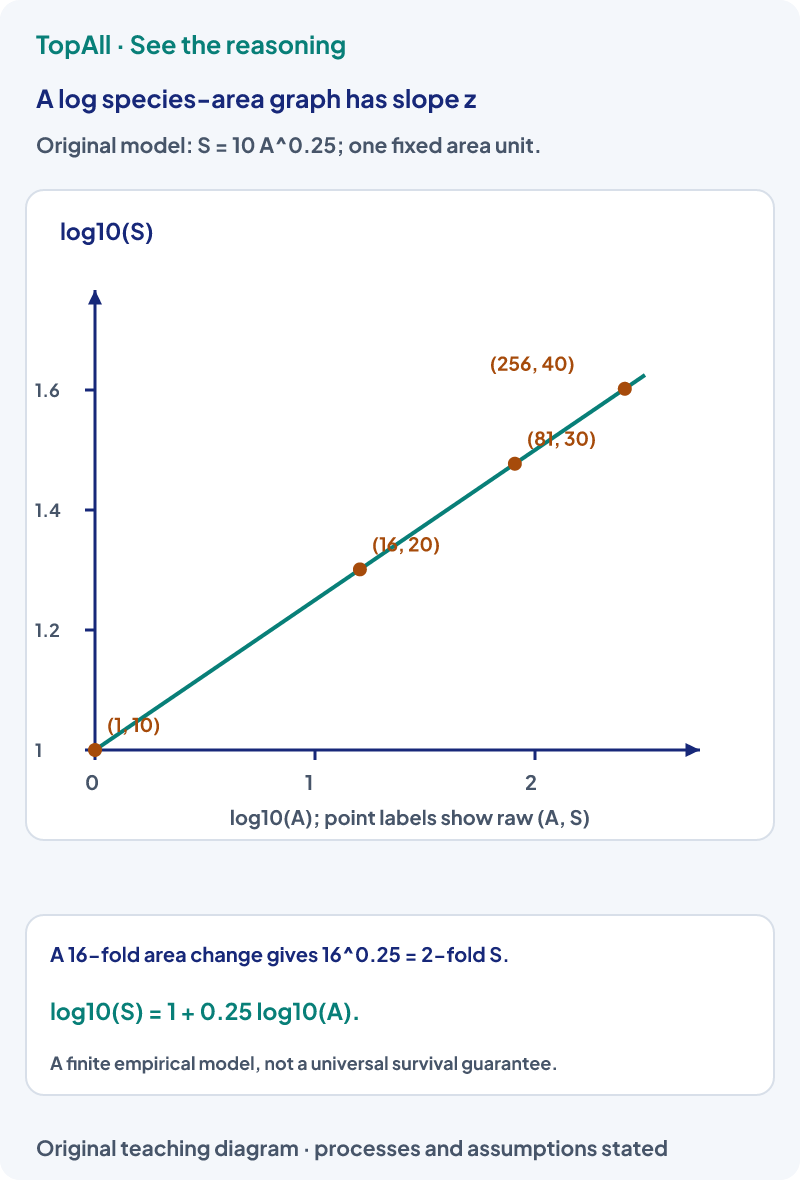
For a fixed model , compare two areas using
Taking base-ten logarithms gives . Here C = 10 gives intercept 1, and z = 0.25 is the slope. Logarithms require a consistent area-unit convention for the numerical model. Changing the area unit changes the fitted numerical constant C; it does not mean the biological community instantly changed.
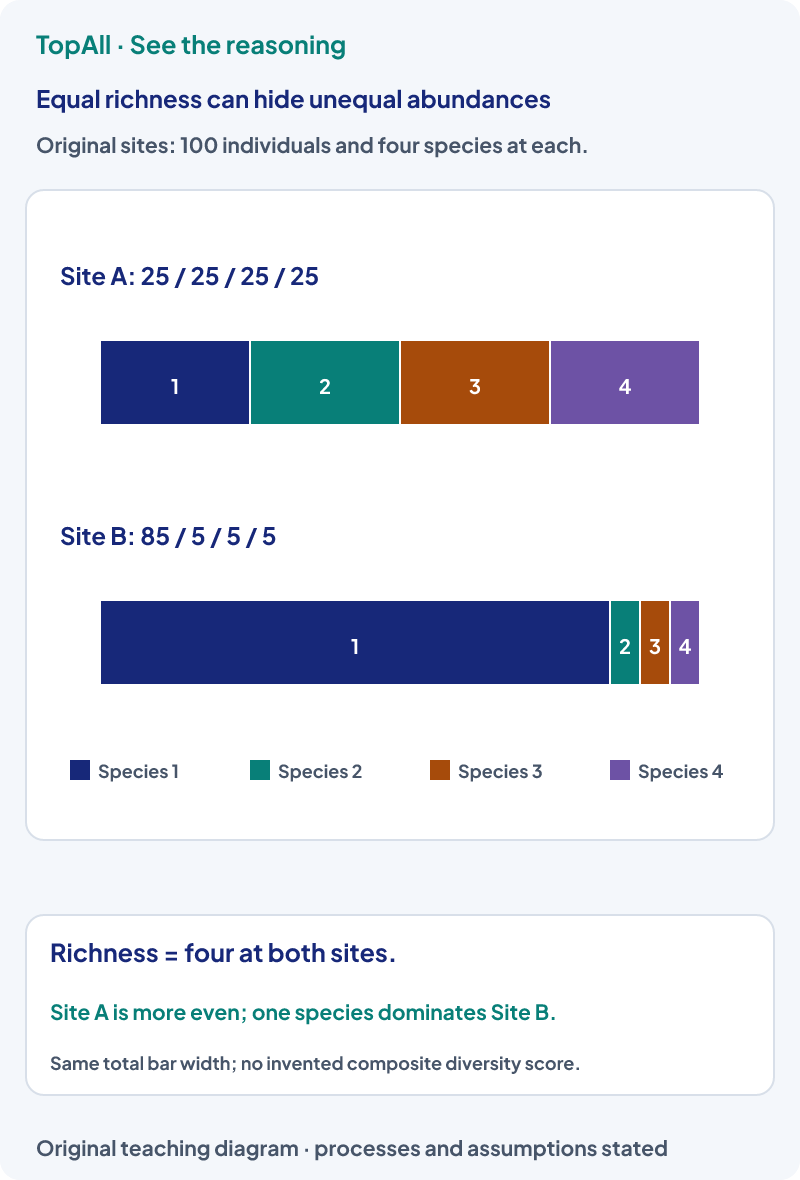
In Site B, one species accounts for 85% of individuals. Richness remains 4 because all four species are present. Calling richness 85 or saying only one species exists confuses abundance with presence. Equal sample size helps the illustration, but real comparisons also need appropriate sampling and identification methods.
Habitat loss and fragmentation can alter available space and connections; overexploitation removes organisms; introduced organisms can change interactions; loss of a dependent species can affect its partners. The effect depends on the ecological relationship. Listing a threat does not establish an exact contemporary extinction count or prove that every introduced organism has the same impact.
Protecting a population and its habitat in its natural ecosystem is an in-situ approach. Conserving suitable material in an offsite seed bank is an ex-situ approach. The second can preserve valuable material but does not by itself maintain every interaction, pollinator or habitat process. The approaches can complement each other rather than one automatically replacing the other.
The equation can describe a pattern over a stated range and set of conditions. It should not be treated as an instant, exact census of which species will persist after arbitrary disturbance. Species identity, habitat quality, time, dispersal and sampling affect interpretation. A larger predicted species count is not proof that all communities with equal area are interchangeable.
Ask whether the question measures presence, abundance, genetic variation or ecosystem variety. For scaling, use ratios and the supplied exponent. For conservation, identify the habitat or offsite setting. Historical textbook inventories should not be repeated as current counts without fresh evidence.
A model has z = 0.5 and the compared area increases fourfold under the same conditions. What species-number ratio does the model predict?
The ratio is four to the power0.5, or2. Do not reuse 0.25 from the illustration when the new question supplies a different exponent. This is a model prediction, not a guaranteed number of species in every real fourfold area expansion.
A sample still contains four species, but its distribution changes from 25/25/25/25 to 85/5/5/5. Has the observed richness fallen?
No. The observed richness remains 4, while abundance becomes less even. This sample alone does not establish what happened to genetic diversity or the wider region. Describe the dimension that was actually measured.
Explain equal richness with unequal evenness and calculate an area-ratio prediction. Connect environmental mechanisms in Environmental Issues, or revisit the unit population in Organisms and Population.
Practice opens the broad conservation pool rather than a species-area-only set.
Technical review: Codex (automated), 24 October 2026. Core mechanisms were compared with the linked primary textbooks and university or government references. All diagrams, problem inputs and explanations are original. Numerical balances and diagram directions are checked separately. Independent human subject review is not claimed. These focused guides support the existing chapter catalogue; they do not claim complete current exam or syllabus coverage.
State the diversity measure, sampling scope and model assumptions before choosing an answer. Use the worked explanation to identify which inference was unsupported.

