NEET UG · Video

Ecological Pyramids NEET Guide
Study ecological pyramids and trophic levels for NEET UG with TopAll.
4 min video

NEET UG · Biology
Revise the concepts. Try a question. Understand your next step.
41 hard questions available · Try answers free. Sign in to save progress or take a quiz.
NEET UG · Biology
Understand the concept, practise questions and check your learning.
Understand
Use consistent productivity units, count trophic transfers and explain why standing biomass differs from energy production. Ecosystem accounting: productivity, transfers and biomass
Read the guidePractise
Try 41 hard chapter MCQs. Untimed; check answers and available explanations as you go.
Practise chapter MCQsCheck your learning
Prepare a timed chapter quiz. Choose the available question count and pace before starting.
Prepare a chapter quizThis is chapter practice, not a full-length NEET mock paper.
These are playable question counts after quality and duplicate checks.
The practice player uses single-correct-answer MCQs. Chapter quizzes are not full-length NEET mock papers. Check the practice guide and official syllabus sources.
Revise before you practise
NEET UG · Video
Study ecological pyramids and trophic levels for NEET UG with TopAll.
4 min video
NEET UG · Video
Learn energy flow in ecosystems clearly for NEET UG with TopAll.
4 min video
NEET UG · Video
Understand decomposition in ecosystems for NEET UG with TopAll.
3 min video
NEET UG · PDF notes
Read PDF · 10 pages →Study ecological pyramids and trophic levels for NEET UG with TopAll.
10 pages
NEET UG · PDF notes
Read PDF · 10 pages →Learn energy flow in ecosystems clearly for NEET UG with TopAll.
10 pages
NEET UG · PDF notes
Read PDF · 9 pages →Understand decomposition in ecosystems for NEET UG with TopAll.
9 pages
NEET UG · Mind map
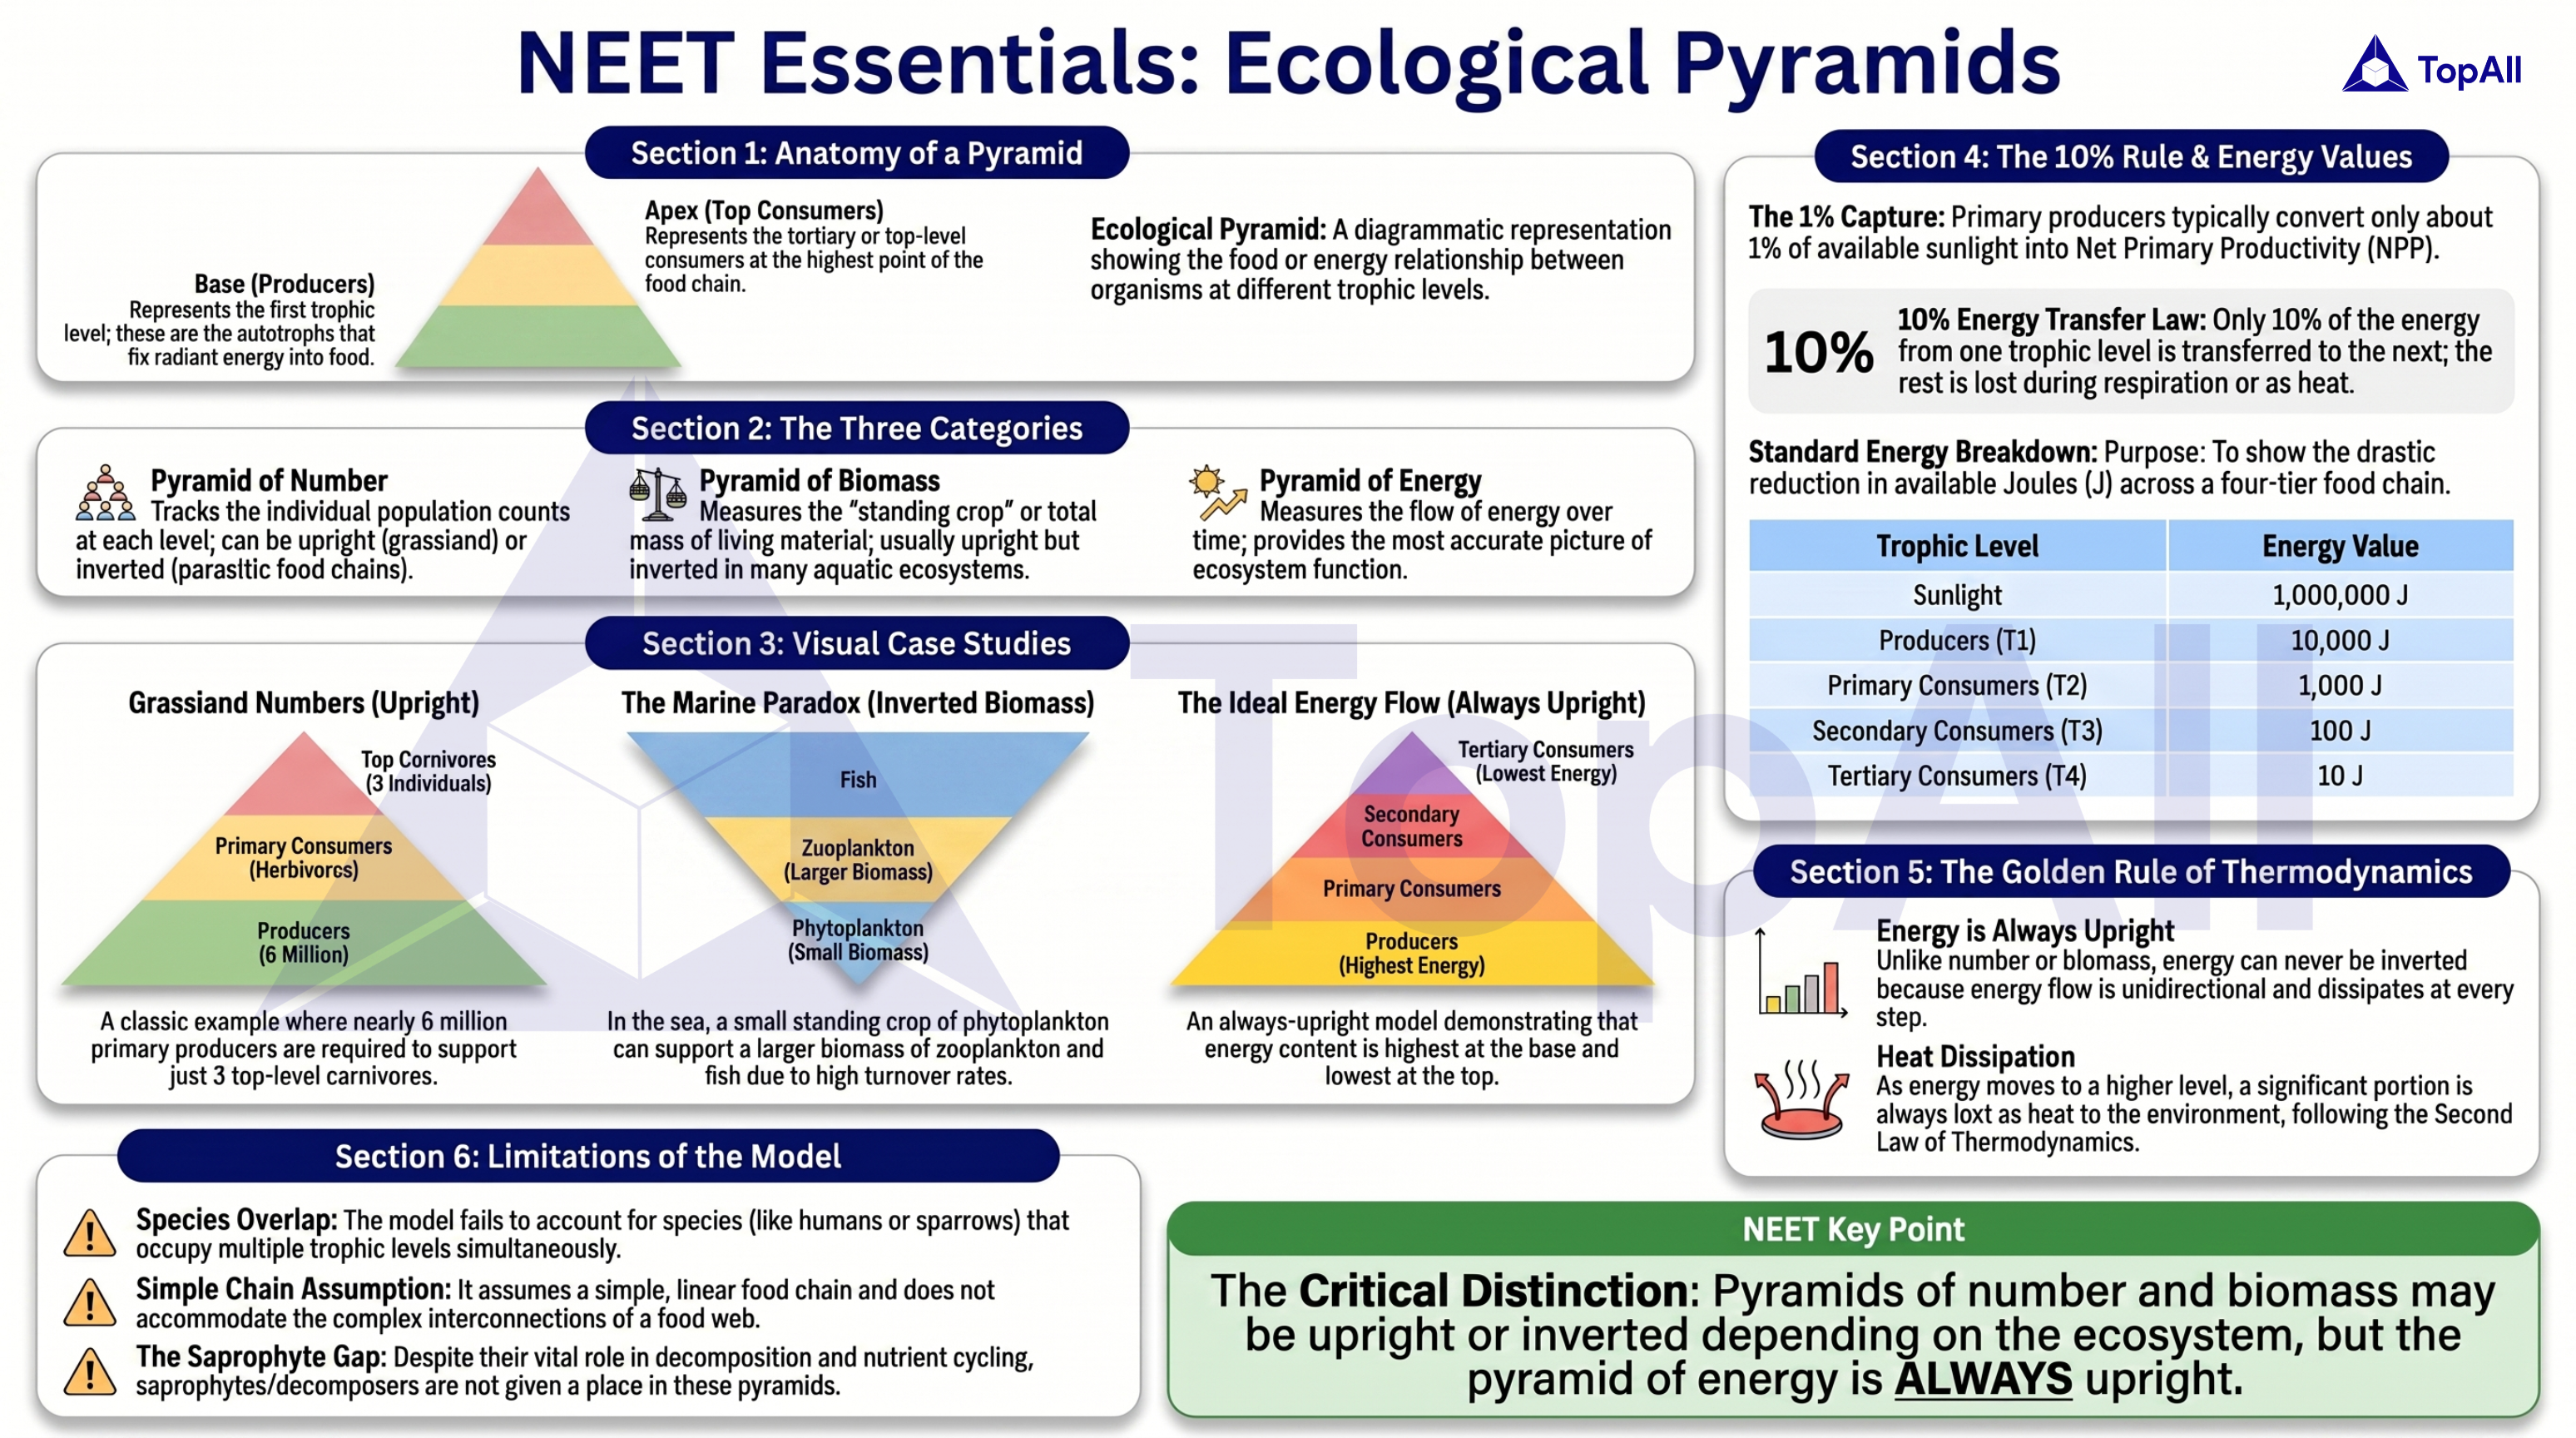
Study ecological pyramids and trophic levels for NEET UG with TopAll.
NEET UG · Mind map
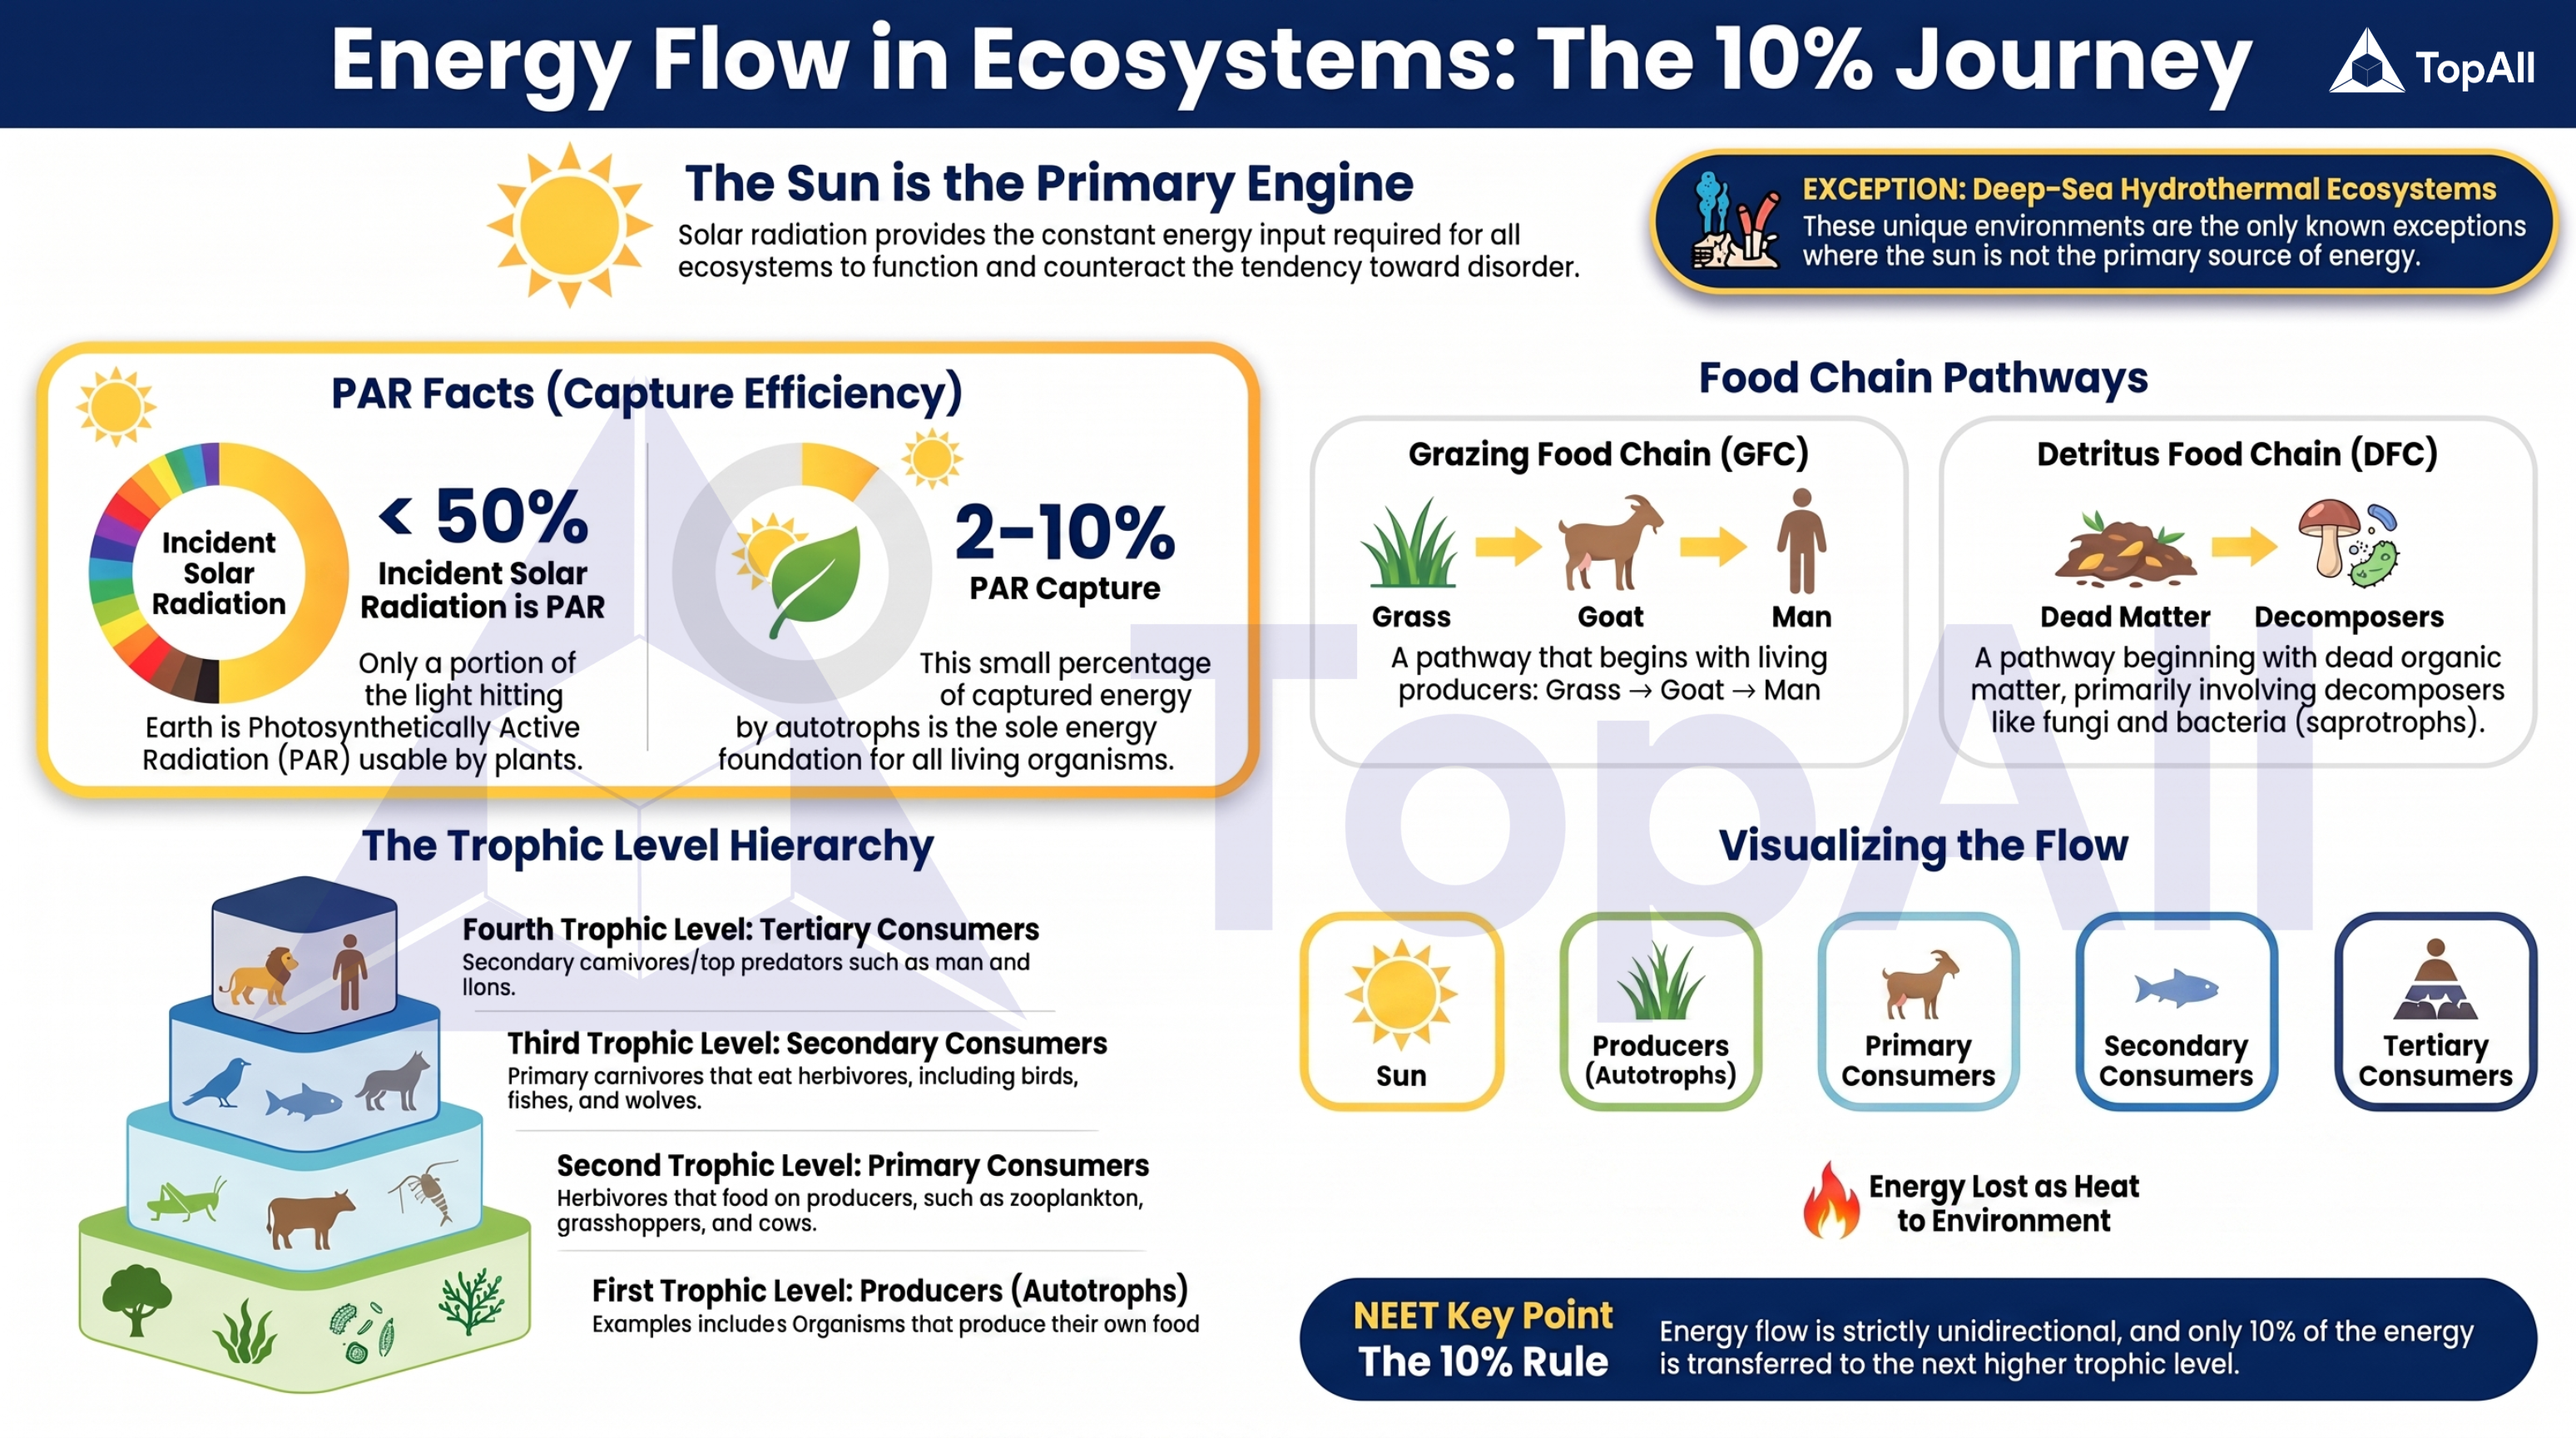
Learn energy flow in ecosystems clearly for NEET UG with TopAll.
NEET UG · Mind map
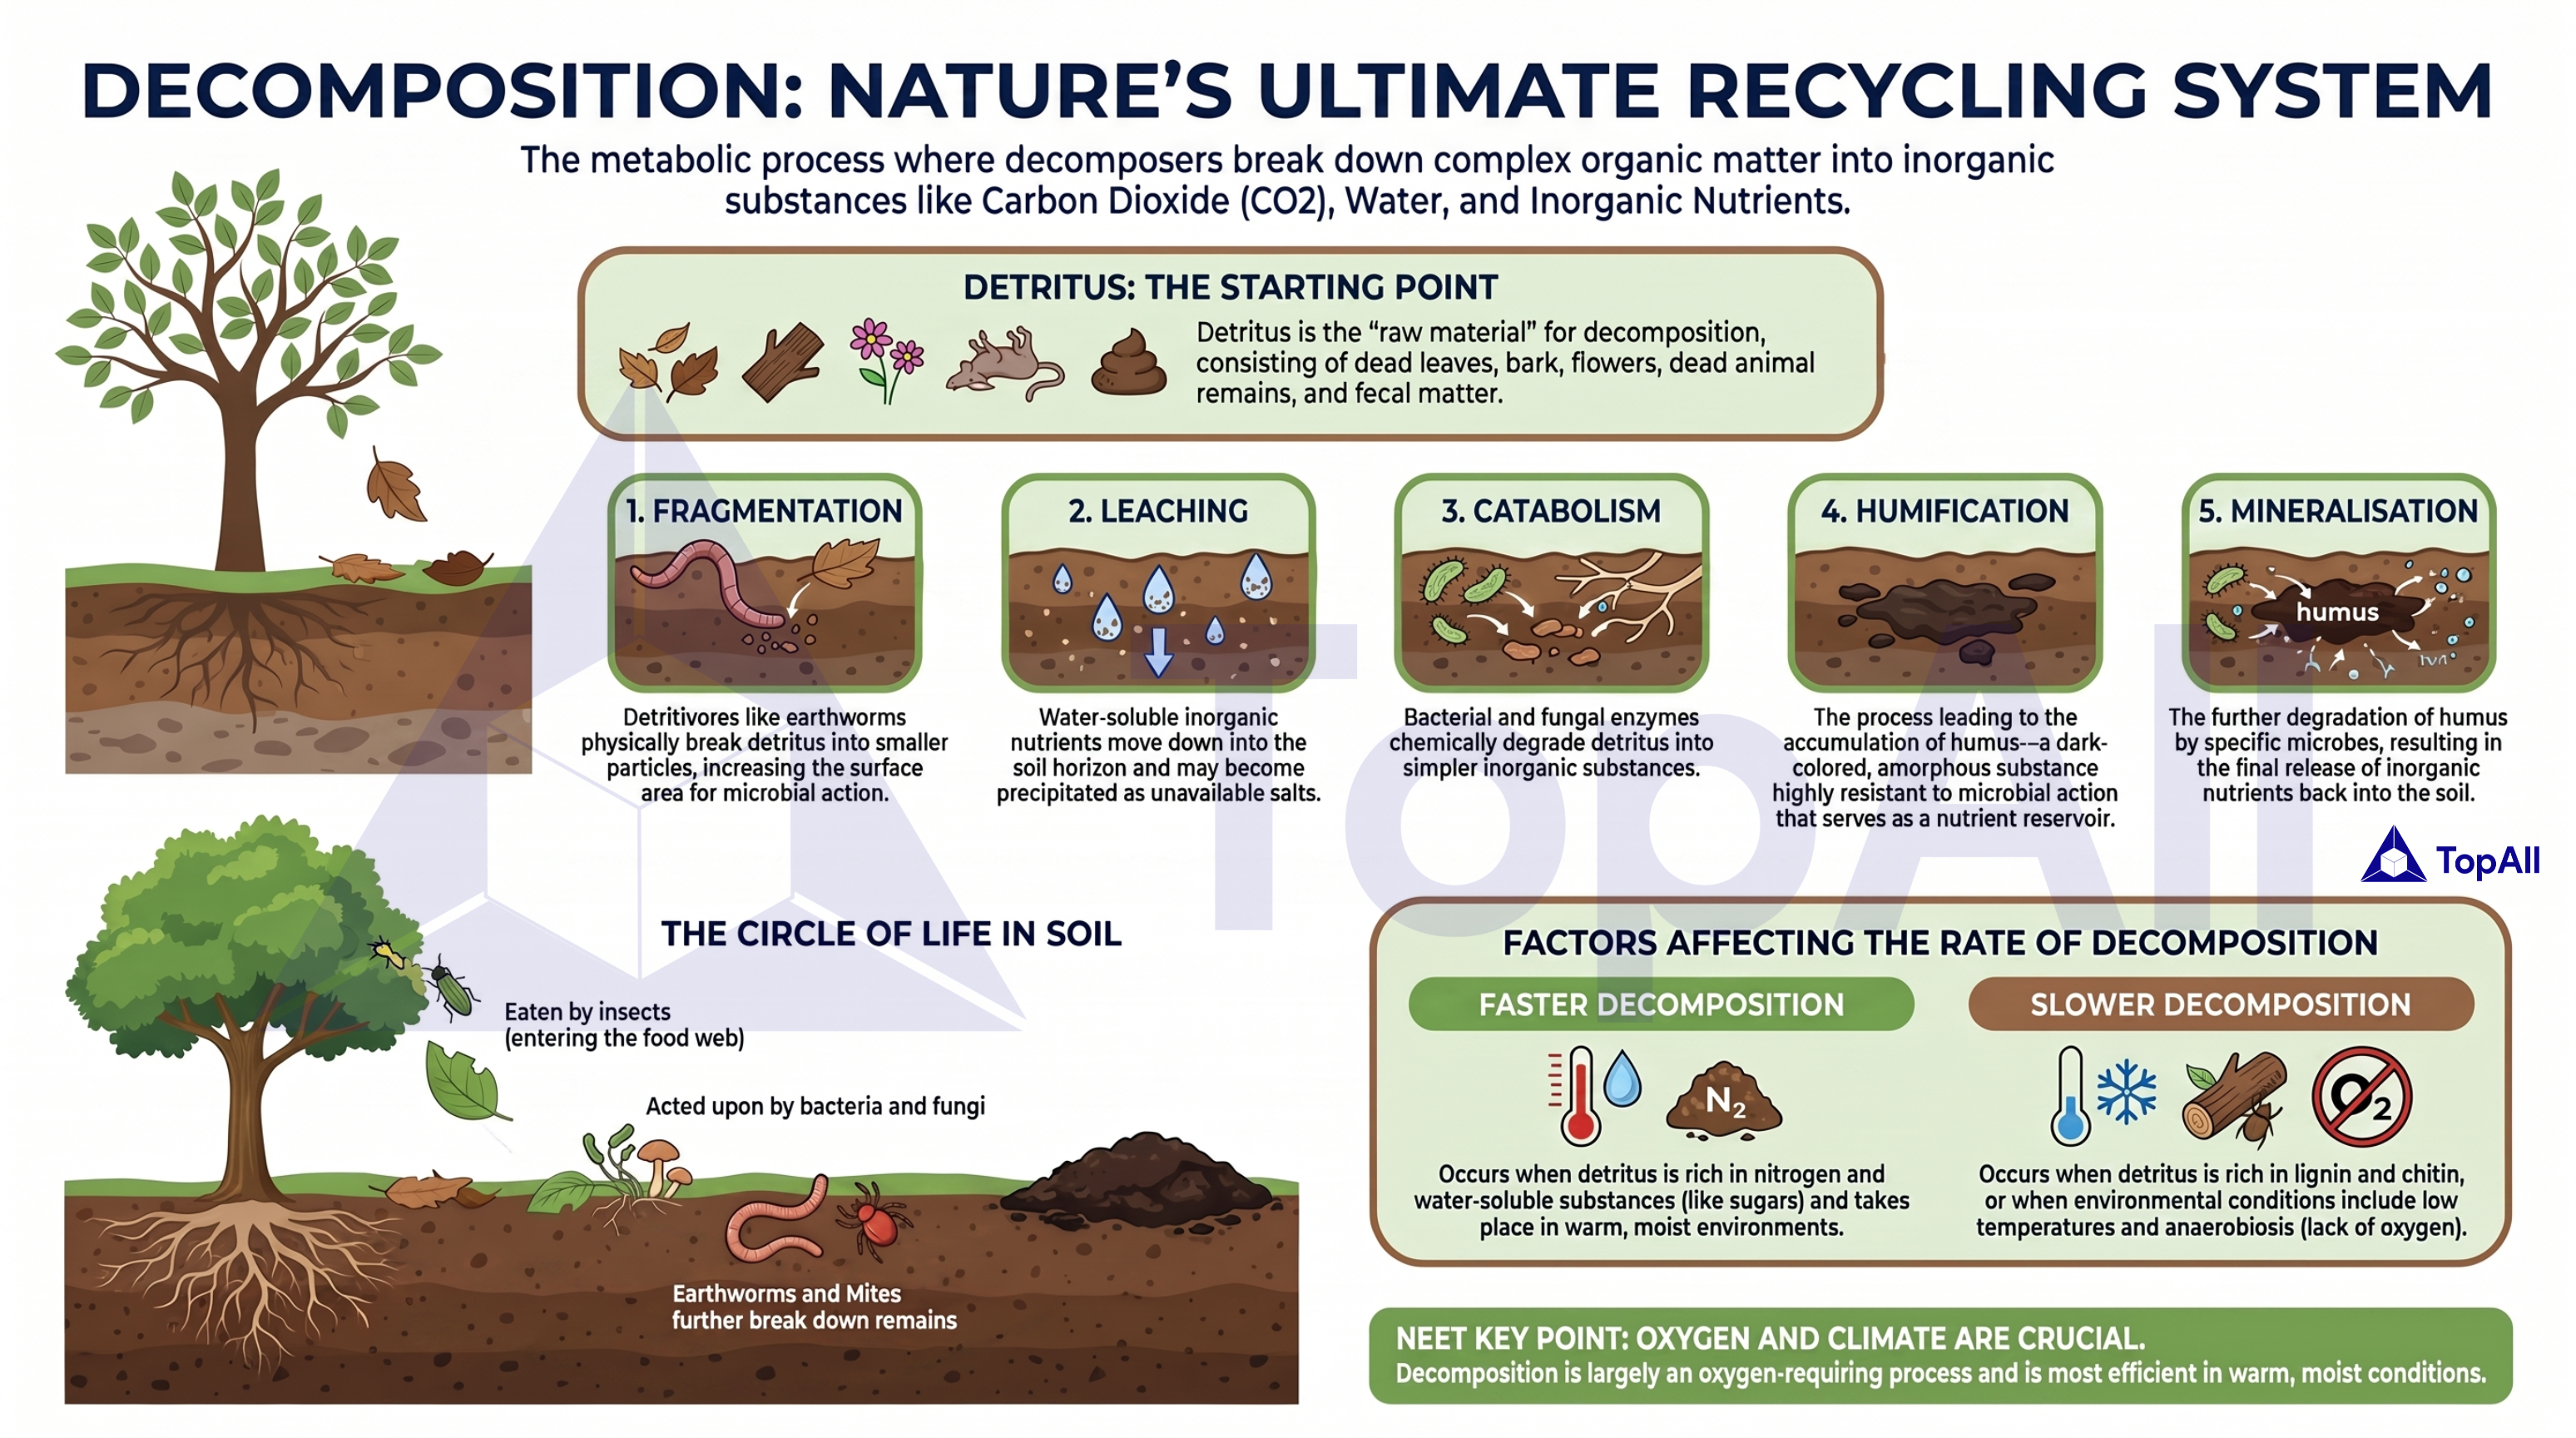
Understand decomposition in ecosystems for NEET UG with TopAll.
Use consistent productivity units, count trophic transfers and explain why standing biomass differs from energy production.
For NEET UG Biology students: keep GPP, NPP and producer respiration on one unit basis, count trophic transfers and distinguish standing biomass from production.
Net primary productivity is gross primary productivity minus the primary producers’ respiratory use: . All terms need the same energy or mass basis, area and time interval. NPP is a production rate available to support other pathways, not a statement that herbivores consume it all. Standing biomass records material present at a moment and answers a different question.
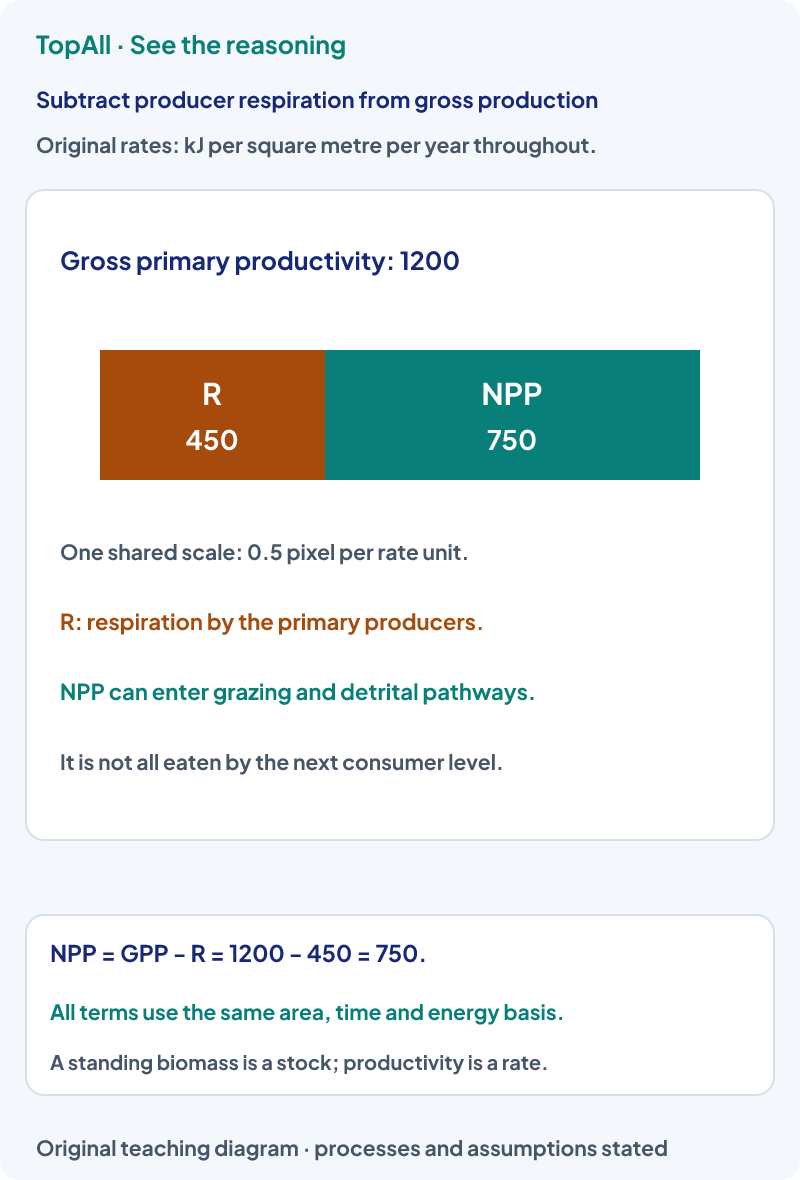
With GPP 1200 and producer respiration 450 in matching units, NPP is 750. Subtracting respiration twice gives 300 and is wrong. Substituting total ecosystem respiration for producer respiration changes the question: net ecosystem production and net primary production are different accounts. Identify whose respiration is supplied before choosing the subtraction.
A supplied trophic transfer efficiency compares production at a receiving level with production at the preceding level on the same basis. It is not automatically the fraction of sunlight captured, the fraction of food ingested or the assimilation efficiency. Those quantities have different denominators. A textbook ten-percent model is a stated approximation, not an exact universal value for every food web.
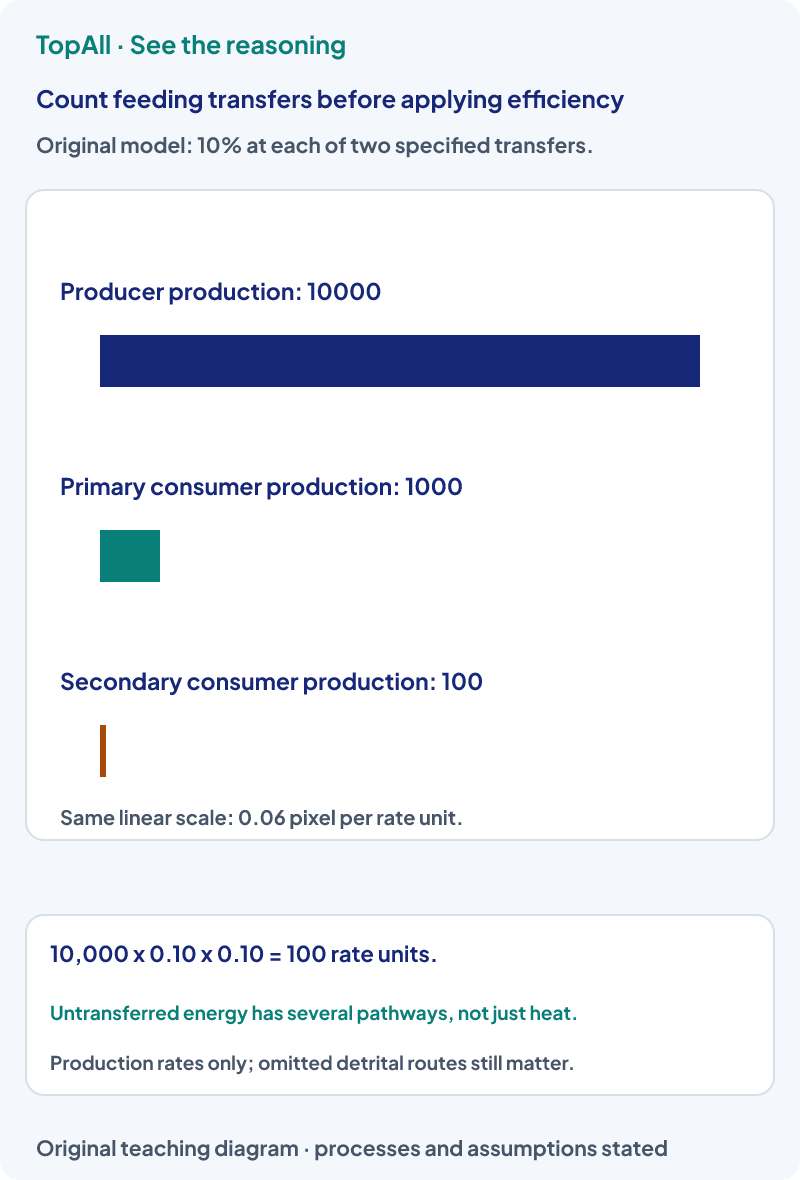
An original producer rate is 15000 energy units per area per time. The next transfer is 10% and the following transfer 20%. The final production rate is 15000 × 0.10 × 0.20 = 300. Using 10% twice gives 150 and ignores the second supplied efficiency. Count links rather than counting the number of organisms or labels in the diagram.
Energy is transformed and dissipated through ecosystem processes; chemical nutrients can be returned to reusable forms through decomposition and mineralisation. Calling both processes a closed energy cycle confuses them. In photosynthetic systems sunlight supplies energy; chemosynthetic primary production shows why “all ecosystems use sunlight directly” is too broad.
A supplied aquatic snapshot shows less standing producer biomass than consumer biomass, but the producers replace their biomass rapidly. A small producer stock can support a larger consumer stock over time through turnover. This does not mean higher consumers create more energy than they receive. A stock measured at one moment and a production rate measured over time must not be treated as the same pyramid.
Fragmentation breaks material into smaller pieces, leaching moves soluble substances, and microbial processes alter organic matter. Humification and mineralisation describe different outcomes. These processes can overlap; they need not form one rigid sequence in which each finishes before the next begins. Temperature, moisture and substrate properties affect the actual rates.
Write the unit beside every value. Check whether R refers to producers, whether the efficiency denominator matches the problem, and whether the quantity is a stock or a rate. Do not call all untransferred energy heat or silently exclude the detrital pathway from a full ecosystem explanation.
Producer production is 20000 in common rate units. Two successive transfers are each 10%. What is the production at the second consumer level?
20000 × 0.10 × 0.10 = 200 rate units. There are three labelled levels but only two transfers. Applying a third factor would give 20 and count a link that was not supplied.
A question supplies GPP in kJ per square metre per year and a standing biomass in grams per square metre. Can you subtract them directly to find NPP?
No. The quantities have different physical dimensions and different time meanings. NPP requires matching production and producer respiratory terms. A mass-to-energy conversion alone would still not turn a standing stock into an annual respiration rate.
Recreate the productivity ledger and count two feeding links. Connect population turnover in Organisms and Population, or follow oxygen demand in Environmental Issues.
The practice action opens the broad ecosystem pool, not an energy-transfer-only set.
Technical review: Codex (automated), 24 October 2026. Core mechanisms were compared with the linked primary textbooks and university or government references. All diagrams, problem inputs and explanations are original. Numerical balances and diagram directions are checked separately. Independent human subject review is not claimed. These focused guides support the existing chapter catalogue; they do not claim complete current exam or syllabus coverage.
Choose the quantity you confused: producer respiration, transfer efficiency or standing biomass. State its units, then check your reasoning with chapter questions.