
What you will take away
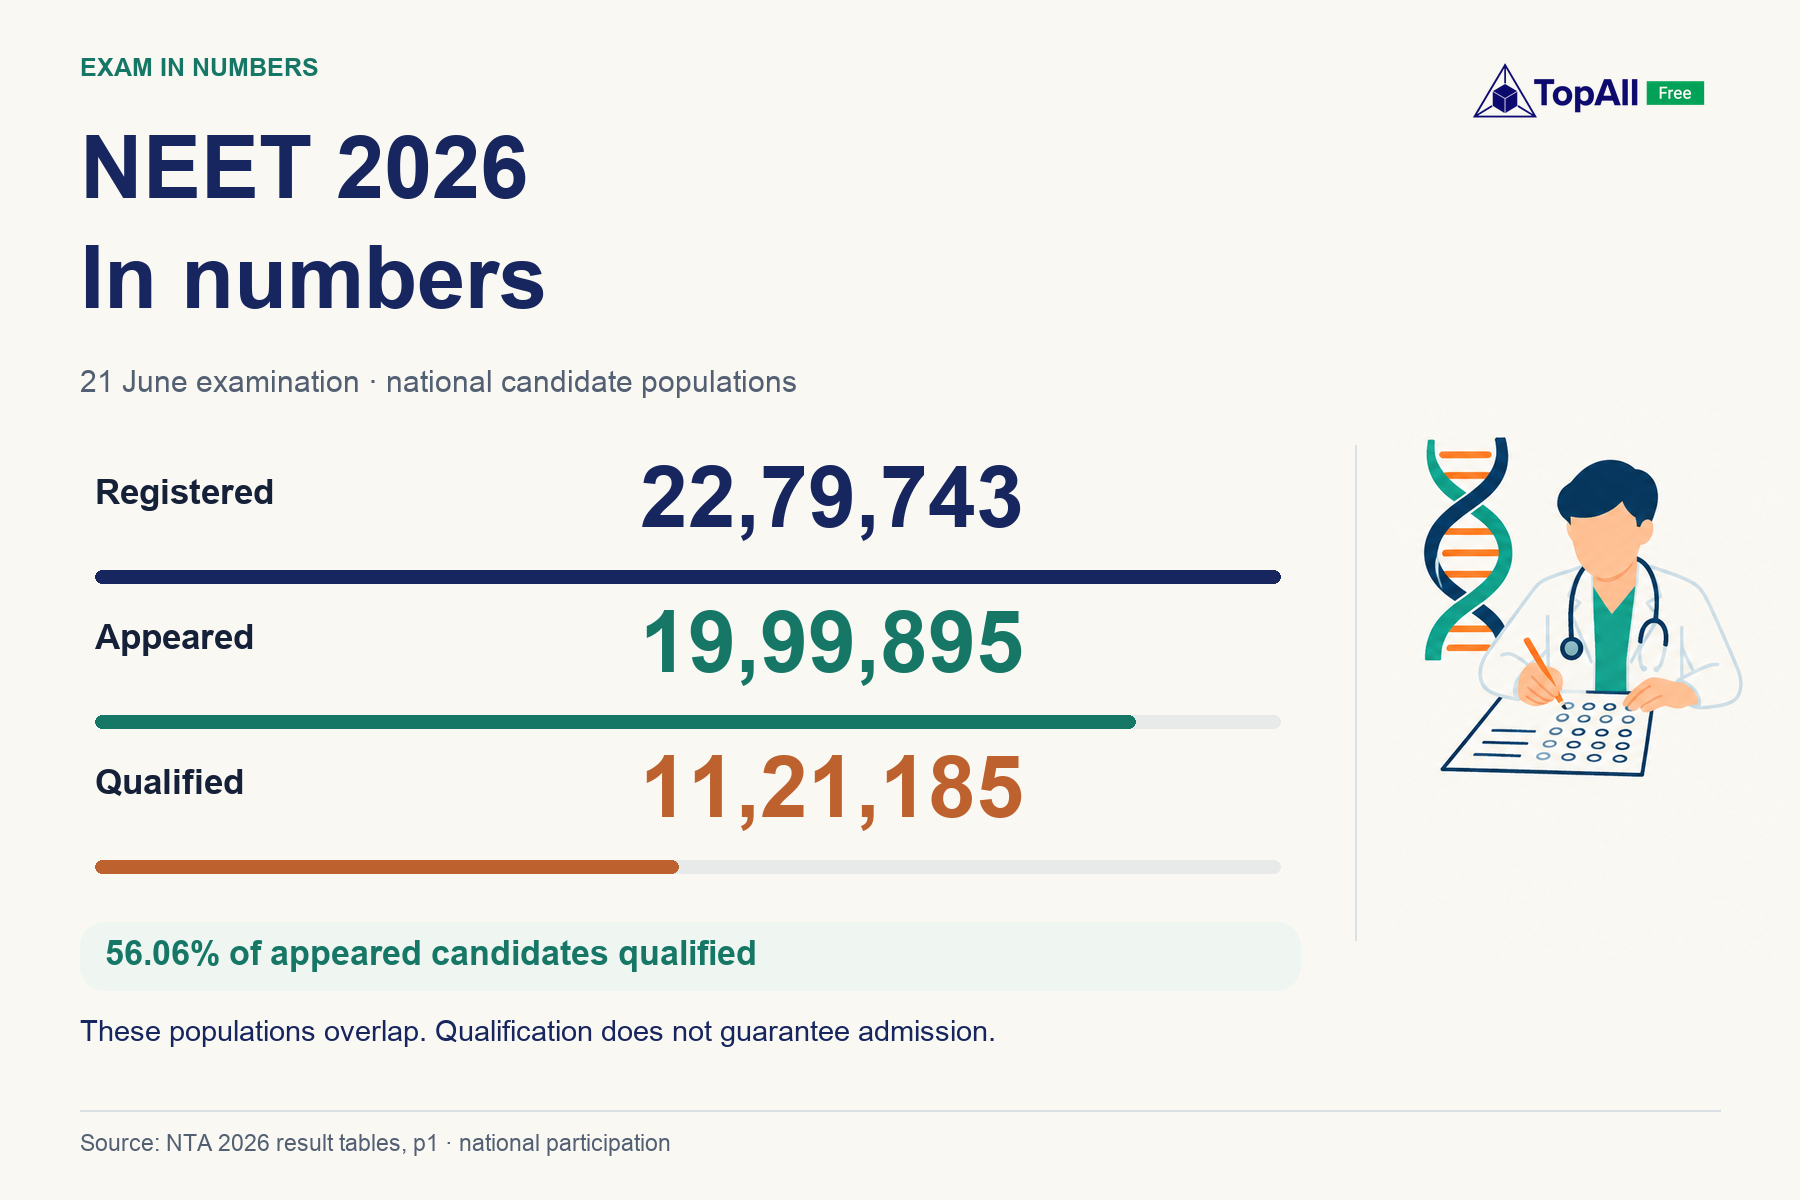
- 22,79,743 registered; 19,99,895 appeared; 11,21,185 qualified. Keep the populations separate.
- The six largest state rows account for 54.41% of attendance. Explore your state or UT and compare its 2025 and 2026 counts.
- The 2026 test-taker qualification share was 56.06%. Qualification does not equal admission.
- NMC’s dated MBBS matrix lists 1,40,664 seats excluding INIs; it is capacity within that scope.
Start here if: You want to understand the exam’s scale without confusing marks, ranks, eligibility and admission.
Jump to a section
One exam. Three different counts.
NEET UG 2026 had 22,79,743 registered candidates. Of them, 19,99,895 appeared and 11,21,185 qualified. These are three stages, not three separate groups to add together. NTA’s exact tables provide the counts; its result release summarises the qualified total as 11.21 lakh.
The result data used here relates to the 21 June 2026 examination, with results released on 16 July. The official website distinguishes this re-examination from the earlier 3 May sitting. Keep the sitting and result version attached whenever you compare a number.

Follow the candidates through the exam
Exact NTA counts · 21 June 2026 examination
Applied for the examination
Sat the examination
Met the applicable qualifying criteria
The stages overlap. Qualification is not a seat allotment.
View the exact data
| Stage | Candidates |
|---|---|
| Registered | 22,79,743 |
| Appeared | 19,99,895 |
| Qualified | 11,21,185 |
| Absent | 2,79,848 |
Applications stayed almost flat. Attendance fell.
Compared with 2025, registrations rose by just 3,674 candidates, or 0.16%. Attendance fell by 2,09,423, or 9.48%. A registration headline alone would miss that difference.
In 2026, 2,79,848 registered candidates were absent, compared with 66,751 in 2025. These counts describe participation. They do not explain why someone was absent, prove the paper was harder, or predict a future cutoff.
Almost the same registrations. Fewer test takers.
2025 and 2026 · shared scale from 0 to 25 lakh candidates
The attendance change is descriptive. These counts do not establish why attendance changed or how difficult a paper was.
View the exact data
| Year | Registered | Appeared | Absent |
|---|---|---|---|
| 2025 | 22,76,069 | 22,09,318 | 66,751 |
| 2026 | 22,79,743 | 19,99,895 | 2,79,848 |
How did participation vary by state?
Uttar Pradesh had the largest appeared count: 3,28,847, or 16.44% of national attendance. Maharashtra followed with 2,01,100 and Rajasthan with 1,92,023. With Bihar, Karnataka and Tamil Nadu, these six state rows account for 54.41% of all test takers.
Choose your state or UT below to compare its 2025 and 2026 counts. Check the qualification share as well as the number of qualifiers: scale and proportion tell different stories.
Six state rows account for 54.41% of attendance
2026 appeared candidates · six largest state counts · shared zero-based scale
Find your state or UT
Uttar Pradesh
2026 · NTA source classification
- Attendance among registered
- 92.35%
- Qualified among appeared
- 51.93%
- Share of national attendance
- 16.44%
2025 appeared: 3,33,088. Change in 2026: −4,241 (−1.27%).
State/UT labels follow the NTA table, including its separate Dadra & Nagar Haveli and Daman & Diu rows. They do not establish counselling domicile. Counts and qualification shares describe different populations; neither ranks teaching quality.
View all 38 source rows · 2026
| NTA state / UT label | Registered | Appeared | Qualified |
|---|---|---|---|
| Andaman & Nicobar Islands | 895 | 717 | 369 |
| Andhra Pradesh | 65,957 | 60,186 | 33,221 |
| Arunachal Pradesh | 4,891 | 3,940 | 2,179 |
| Assam | 43,187 | 36,283 | 18,435 |
| Bihar | 1,52,924 | 1,40,079 | 68,968 |
| Chandigarh | 2,854 | 2,622 | 1,839 |
| Chhattisgarh | 45,781 | 41,111 | 21,291 |
| Dadra & Nagar Haveli | 1,200 | 1,074 | 573 |
| Daman & Diu | 647 | 603 | 326 |
| Delhi | 59,669 | 53,846 | 35,132 |
| Goa | 4,360 | 3,675 | 1,885 |
| Gujarat | 79,190 | 68,833 | 38,146 |
| Haryana | 65,328 | 59,287 | 36,622 |
| Himachal Pradesh | 18,648 | 16,744 | 9,595 |
| Jammu and Kashmir | 56,420 | 50,110 | 25,007 |
| Jharkhand | 38,405 | 35,051 | 19,039 |
| Karnataka | 1,45,852 | 1,17,564 | 65,901 |
| Kerala | 1,13,786 | 84,664 | 51,782 |
| Lakshadweep | 135 | 90 | 43 |
| Madhya Pradesh | 1,18,084 | 1,05,514 | 55,655 |
| Maharashtra | 2,22,849 | 2,01,100 | 1,07,304 |
| Manipur | 9,657 | 8,321 | 5,070 |
| Meghalaya | 4,183 | 3,425 | 1,658 |
| Mizoram | 2,624 | 2,166 | 1,353 |
| Nagaland | 3,866 | 3,289 | 1,946 |
| Odisha | 56,786 | 50,009 | 28,336 |
| Puducherry | 5,402 | 4,716 | 2,451 |
| Punjab | 34,858 | 29,351 | 15,749 |
| Rajasthan | 2,08,583 | 1,92,023 | 1,33,140 |
| Sikkim | 1,323 | 1,092 | 579 |
| Tamil Nadu | 1,42,494 | 1,08,601 | 61,306 |
| Telangana | 73,084 | 65,121 | 38,026 |
| Tripura | 4,677 | 3,654 | 1,807 |
| Uttar Pradesh | 3,56,079 | 3,28,847 | 1,70,770 |
| Uttarakhand | 20,344 | 18,001 | 10,127 |
| West Bengal | 1,08,944 | 93,381 | 52,746 |
| Ladakh | 1,045 | 899 | 491 |
| Others (including Outside India) | 4,732 | 3,906 | 2,318 |
Women formed the majority of test takers and qualifiers.
NTA records 11,52,152 female appeared candidates, accounting for 57.61% of test takers. Of all qualified candidates, 6,54,049 were female: 58.34%. Those percentages have different denominators: appeared candidates in the first, qualified candidates in the second.
The exact table keeps all three gender labels in NTA’s source. These figures show who participated and qualified; they do not explain the reasons behind the differences.
Women account for 58.34% of qualified candidates
2026 · qualified candidates by NTA gender label · shared scale from zero
The exact table retains all three source labels, including two qualified third-gender candidates. The chart describes representation, not an explanation of performance.
View the exact data
| NTA gender label | Registered | Appeared | Qualified |
|---|---|---|---|
| Male | 9,46,815 | 8,47,732 | 4,67,134 |
| Female | 13,32,914 | 11,52,152 | 6,54,049 |
| Third gender | 14 | 11 | 2 |
Thirteen exam languages. More than one route into the paper.
20.67% of registrations chose an examination language other than English. English accounted for 18,08,535 registrations, Hindi for 3,45,247, and the other eleven languages together for 1,25,961.
Among those eleven, Gujarati had 49,647 registrations, Bengali 38,577 and Tamil 29,845. Open the data table to see every language. These are examination-language choices at registration, not a breakdown of who appeared or qualified. The table cannot tell us a student’s first language or which language produces better outcomes.
About one in five registrations chose a language other than English
2026 exam-language choices · denominator: 22,79,743 registered candidates
These are registration choices, not attendance, first language or language-wise qualification rates. Other 11 languages is the sum of the eleven named rows outside English and Hindi.
View the exact data
| Exam language | Registered | Share of registrations |
|---|---|---|
| English | 18,08,535 | 79.33% |
| Hindi | 3,45,247 | 15.14% |
| Gujarati | 49,647 | 2.18% |
| Bengali | 38,577 | 1.69% |
| Tamil | 29,845 | 1.31% |
| Assamese | 2,147 | 0.09% |
| Telugu | 1,339 | 0.06% |
| Marathi | 1,144 | 0.05% |
| Urdu | 919 | 0.04% |
| Malayalam | 787 | 0.03% |
| Odia | 716 | 0.03% |
| Kannada | 614 | 0.03% |
| Punjabi | 226 | 0.01% |
Qualified means a threshold was met. Admission comes later.
Among the candidates who appeared, 56.06% qualified: 11,21,185 divided by 19,99,895. About 56 out of every 100 test takers met the applicable qualifying criteria. This is an aggregate across candidates, not one universal cutoff for every category.
Qualification is an eligibility step. Admission still depends on the relevant rank, course, category, quota, choices, documents and counselling process. NTA conducts the exam and issues ranks; MCC and the relevant State authorities handle MBBS/BDS counselling. NEET results are also used for other courses, so the qualified pool cannot be treated as an MBBS-only applicant count.
About 56 in every 100 test takers qualified
Denominator: all 19,99,895 appeared candidates · percentage rounded
This aggregate combines the applicable qualifying criteria. It is not an individual admission probability.
View the exact data
| Outcome | Candidates | Share |
|---|---|---|
| Qualified | 11,21,185 | 56.06% |
| Did not qualify | 8,78,710 | 43.94% |
A score threshold tells a story, but it is not a seat cutoff.
The official result release reports how many candidates reached selected score thresholds. At 500 and above there were 90,780 candidates; at 600 and above, 10,160; at 650 and above, 1,492.
These groups overlap: someone scoring 650 belongs to all three. Do not add the bars. These are score counts, not exact ranks, college closing scores or promises about another year. Your category, quota and course still matter when reading an admission record.
How many candidates reached each score threshold?
Cumulative, overlapping groups · marks out of 720 · zero-based scale
Do not add these bars: a 650+ scorer is also included in the 600+ and 500+ groups. These are not college admission cutoffs.
View the exact data
| Marks out of 720 | Candidates |
|---|---|
| 500 and above | 90,780 |
| 600 and above | 10,160 |
| 650 and above | 1,492 |
Read the seat count with its scope attached.
NMC’s matrix for academic year 2026–27, as on 18 September 2026, lists 1,40,664 MBBS seats: 64,121 government and 76,543 private. Its heading explicitly excludes Institutes of National Importance (INIs). This is the total within that matrix, not a reconciled total for every MBBS institution in India.
It is approved capacity, not the number of students admitted or seats still vacant. The notice says the matrix remains subject to revision. BDS and AYUSH seats are outside this MBBS count.
A simple “test takers per seat” ratio would combine different populations and hide quota, fees, course preferences and eligibility. Use the figure to understand the system’s scale; use the appropriate official counselling records to investigate a particular option.
1,40,664 MBBS seats in this NMC matrix
AY 2026–27 · as on 18 September 2026 · EXCLUDING INIs
Approved capacity within the stated scope; not a complete national total, actual admissions or vacant seats. NMC says the matrix is subject to revision.
View the exact data
| Management | Seats |
|---|---|
| Government | 64,121 |
| Private | 76,543 |
| Total within this matrix | 1,40,664 |
Try it: choose the right denominator.
Original data-reading example. A friend says, “49.18% of candidates qualified.” Another says, “56.06% qualified.” Can both calculations be correct?
Reveal the calculation
Yes, if they name different populations. 11,21,185 ÷ 22,79,743 × 100 = 49.18% of registered candidates qualified. 11,21,185 ÷ 19,99,895 × 100 = 56.06% of appeared candidates qualified. For the share of test takers who qualified, use the appeared denominator.
Neither percentage is a personal probability of getting an MBBS seat. Always ask: “Out of whom?”
Now compare two real state rows.
Uttar Pradesh had 1,70,770 qualified candidates; Rajasthan had 1,33,140. Which had more qualifiers, and which had a higher qualification share among its test takers?
Reveal the state comparison
Uttar Pradesh had more qualifiers. Rajasthan had the higher qualification share: 1,33,140 ÷ 1,92,023 = 69.34%, compared with 1,70,770 ÷ 3,28,847 = 51.93% for Uttar Pradesh. A count and a rate answer different questions. This does not isolate teaching quality or predict an individual result.
Calculated from NTA table 9, page 4.
What can you use this for today?
Separate the three questions: Am I ready for the exam? Use a current syllabus and your practice errors. What did this year’s scores look like? Use the official result tables. Which course could I enter? Use the correct counselling year, rank type, category and quota.
If you are preparing for a later examination, these 2026 figures are context, not targets or rules for your year. Choose one chapter you have studied, attempt a short set and write a correction for each mistake. That gives you a useful next action without turning national statistics into a prediction about you.
Quick check: what can the chart actually tell you?
Someone adds the 500+, 600+ and 650+ counts, then calls the total the number of distinct high scorers. Is that a valid reading?
Check your reasoning
No. The groups overlap. Every 650+ scorer is already included in the 600+ and 500+ counts. The 500+ count alone answers how many candidates scored at least 500. None of these counts supplies an exact college closing rank.
Your next study session
Practise, then review your mistakes
Suggested task: choose 10 available chapter questions, allowing about 15 minutes plus error review. Adjust the pace if you are learning the concept for the first time.
- If you have studied DNA and inheritance, try ten available questions from this chapter. Otherwise choose a familiar chapter from the NEET library.
- Separate concept, reading and calculation mistakes in your notes.
- Write one correction and retry the concept after a break. This practice is not a score or admission prediction.
Sources and method
Participation and qualification are transcribed from NTA’s Key Data Points tables, pages 1–2, and checked arithmetically. The score thresholds are cumulative counts from the result release, not mutually exclusive bins or rank estimates. Percentages and year-on-year changes are TopAll calculations, rounded to two decimals unless labelled otherwise. MBBS capacity is the NMC matrix total as on 18 September 2026 for AY 2026–27, excluding INIs; it is not a national admissions total. No causal explanation, individual admission probability or forecast is inferred. The original reading exercise is editorial. Source PDFs and hashes are retained in the local review evidence. State figures retain all 38 rows of NTA table 9 on page 4, including its legacy UT labels and Others (including Outside India); the three columns for each year reconcile exactly to national totals. Gender figures use table 4, page 2. Language counts use table 3, page 2, and reconcile to registrations, not attendance. State qualification share is qualified divided by appeared; attendance is appeared divided by registered; national-attendance share uses national appeared. No state teaching-quality ranking or domicile inference is made.
- NTA: Key Data Points of NEET (UG) over Years
2025–2026 comparisons · PDF page 1 table 1: national participation; page 2 tables 3–4: languages and gender; page 4 table 9: all state/UT candidate counts for 2025 and 2026 · Checked 2026-10-20
- NTA: NEET UG 2026 results press release, 16 July 2026
2026 · PDF page 1: examination sitting; page 2: cumulative score thresholds; pages 3–4: authority and counselling scope · Checked 2026-10-20
- NMC: MBBS seat matrix as on 18 September 2026
Academic year 2026–27 · PDF page 1: excludes INIs and subject to revision; page 5: statewise Grand Total and government/private columns · Checked 2026-10-20
- NTA: official NEET UG 2026 notices
2026 · Public Notices: 21 June re-examination, result release and separate 3 May fee-refund notices · Checked 2026-10-20
Frequently asked questions
Start with your question. Open an answer, then choose one study task to try.
How many students appeared for NEET UG 2026?
NTA’s exact table reports 19,99,895 appeared candidates, out of 22,79,743 registrations. This story uses the result data for the 21 June 2026 examination.
How many candidates qualified, and what percentage is that?
11,21,185 qualified. Dividing by the 19,99,895 who appeared gives 56.06%, rounded to two decimals. Dividing by registrations answers a different question.
Does qualifying guarantee an MBBS seat?
No. Qualification is an eligibility step. Admission depends on the applicable rank, category, quota, course, choices, documents, seat availability and counselling rules.
Is 1,40,664 the complete number of MBBS seats in India?
It is the total in NMC’s matrix for AY 2026–27 as on 18 September 2026, excluding Institutes of National Importance. It is not a reconciled count of all MBBS institutions, actual admissions or vacancies.
Can I add the 500+, 600+ and 650+ score counts?
No. They are overlapping cumulative thresholds. A candidate scoring 650 is included in all three groups.
Can these figures predict my rank or next year’s cutoff?
No. Participation and selected score counts do not provide a complete score-to-rank mapping, and a later year has its own paper, cohort and rules. Historical admission cutoffs also require matching category, quota, course and counselling round.
Where should I check counselling information?
Use MCC and the relevant official State counselling authority for the applicable MBBS/BDS quota. NTA’s result release identifies the counselling roles; check the live official notices for current dates and requirements.
Why does the explorer include 38 rows rather than just the current states and UTs?
It retains NTA’s source labels, including separate Dadra & Nagar Haveli and Daman & Diu rows and Others (including Outside India). These are source classifications, not a new geographic or counselling-domicile map.
Does a higher state qualification percentage mean better coaching?
The table cannot establish that. Candidate composition, preparation and other factors are not controlled here. A count describes scale; the qualification share uses that state row’s appeared candidates as its denominator. Neither establishes a cause or an individual admission chance.