
What you will take away
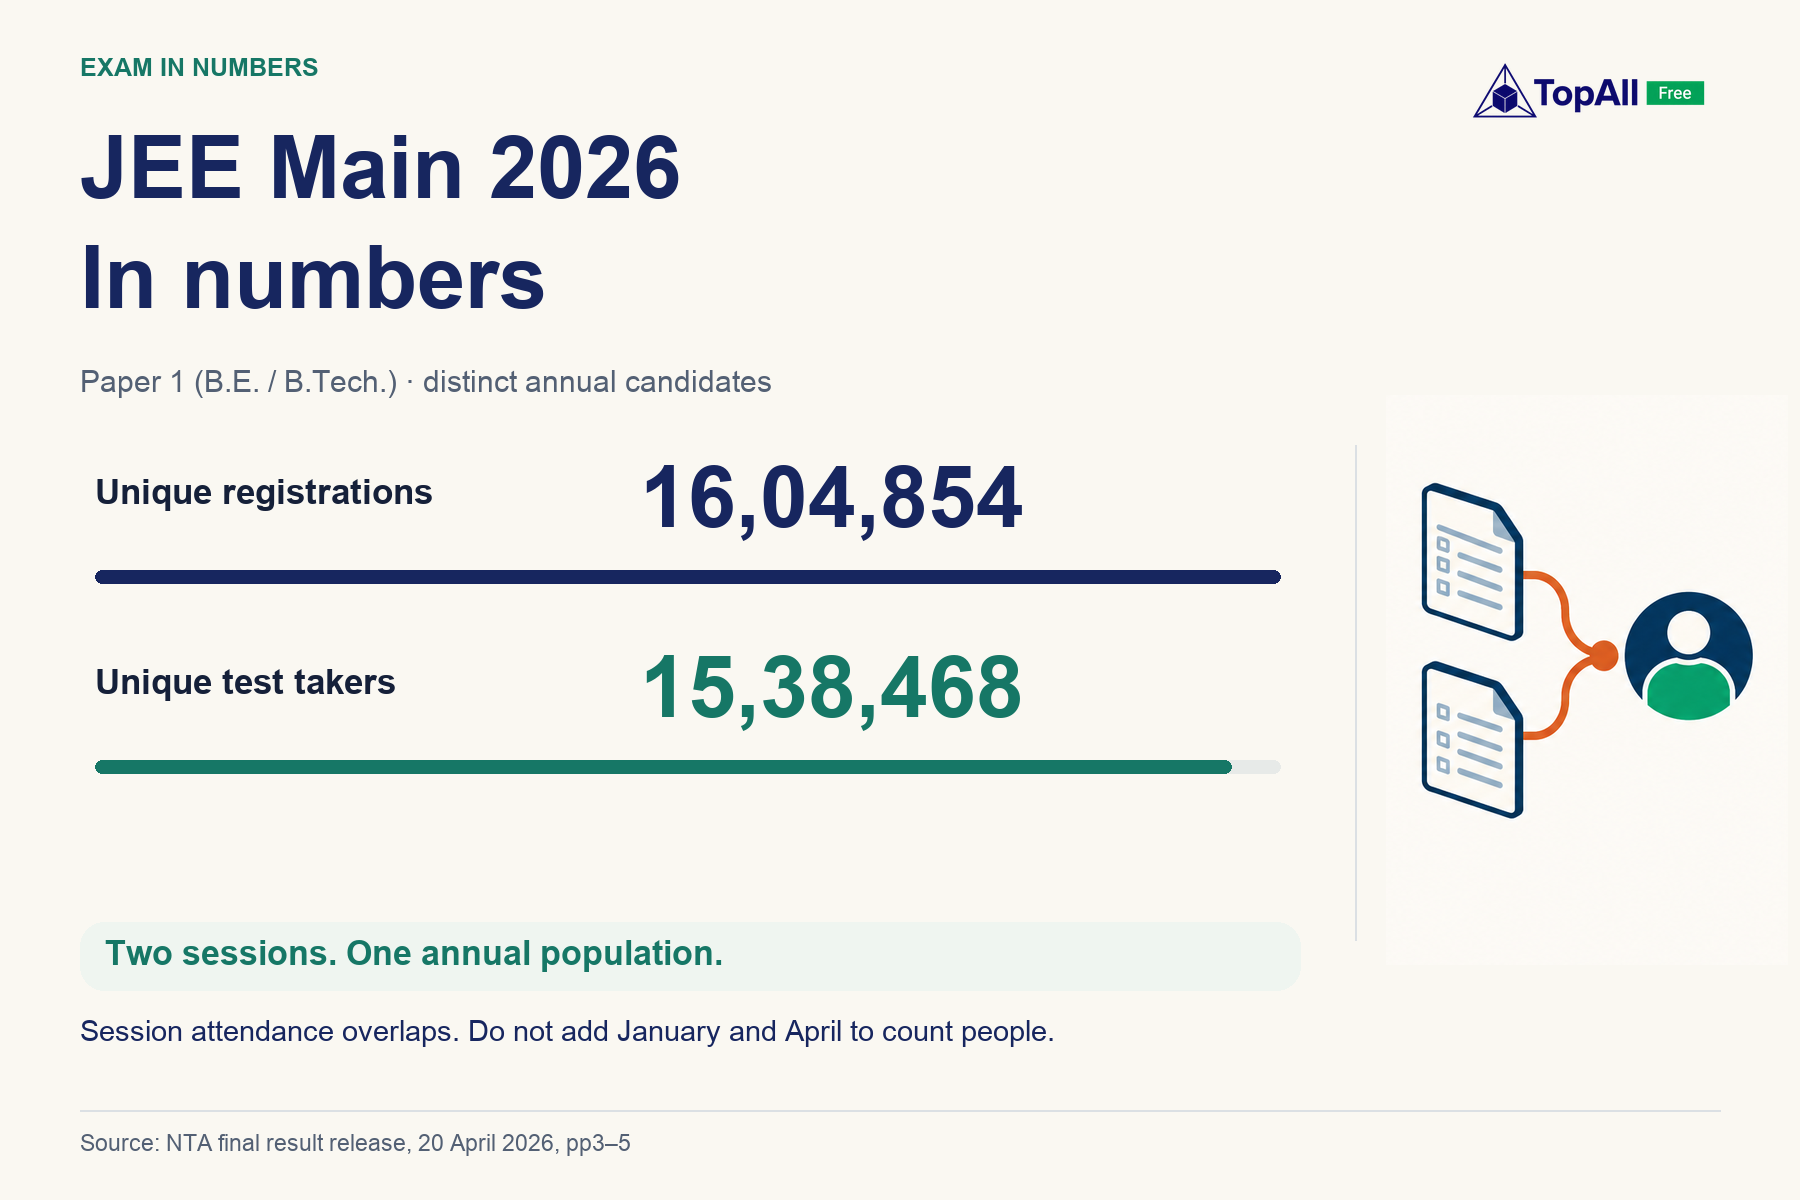
- NTA reports 16,04,854 unique registrations and 15,38,468 unique test takers for Paper 1.
- January and April overlap. Keep session attendance separate from distinct annual candidates.
- A percentile is different from percentage marks; the Advanced eligibility threshold is different from an admission cutoff.
- Use the shift explorer to inspect scheduled groups, then choose your own chapter to practise.
Start here if: You want to understand JEE Main statistics without mixing sessions, percentiles, eligibility and admission.
Jump to a section
One year. Two sessions. Count people carefully.
JEE Main 2026 Paper 1 brought together 16,04,854 unique registrations and 15,38,468 unique test takers, according to NTA’s final release. “Unique” matters: a student who sat both sessions is counted once in the annual total.
This story follows B.E. and B.Tech. Paper 1. Architecture and planning papers have their own results. The numbers below describe this edition; they are not targets or rules for a later examination.

Count candidates once across the year
2026 Paper 1 · annual unique candidates unless a different group is named
Already part of annual attendance
Final annual list, not full raw marks
These cards describe different, overlapping groups. Do not add them.
View the exact data
| Population | Candidates |
|---|---|
| Unique registered | 16,04,854 |
| Unique appeared | 15,38,468 |
| Appeared in both | 8,00,516 |
| Annual 100 NTA score | 26 |
January and April overlap. They are not two separate crowds.
Some students took one session; others returned for the second. NTA reports 8,00,516 candidates who appeared in both. Adding the two attendance totals would count those students twice.
Switch sessions below to see registrations and attendance on the same scale. The exact table also shows NTA’s annual totals and the common-candidate counts.
A one-candidate difference in the official attendance table
January attendance plus April attendance minus common attendance is 13,04,653 + 10,34,330 − 8,00,516 = 15,38,467. NTA’s annual unique-attendance row reports 15,38,468. We retain both source values and flag the difference of one. The registration rows do reconcile. These bars compare each session separately; they are not pieces of a reconciled annual whole.
Read each session on the same scale
Paper 1 · counts start at zero · shared maximum 15 lakh
January · Session 1
A one-candidate difference remains in the attendance-overlap arithmetic. All source figures are retained; open the note above for the calculation.
View the exact data
| Population | Registered | Appeared |
|---|---|---|
| January · Session 1 | 13,55,293 | 13,04,653 |
| April · Session 2 | 11,10,904 | 10,34,330 |
| Common to both | 8,61,343 | 8,00,516 |
| Annual unique | 16,04,854 | 15,38,468 |
More unique candidates appeared than in 2025.
Compare annual unique Paper 1 counts with the same kind of count in the previous edition. Both registrations and attendance increased in 2026. That tells us the scale changed; it does not tell us the paper was harder or that a particular student’s rank would change by a fixed amount.
Keep the comparison attached to these two result editions. A session-only figure would answer a different question.
Compare unique people with unique people
Annual Paper 1 populations · 2025 and 2026 · shared scale from 0 to 17 lakh
2025
2026
2025 uses its final annual release; 2026 uses the reported annual row, with its one-candidate overlap discrepancy retained. Changes in population alone do not establish difficulty.
View the exact data
| Year | Registered | Appeared |
|---|---|---|
| 2025 | 15,39,848 | 14,75,103 |
| 2026 | 16,04,854 | 15,38,468 |
Who took the exam? Start with the population.
A participation count tells you how many people were represented. A percentage tells you their share of a defined group. Change the view from registered to appeared and watch the denominator change with it.
The chart uses the gender labels in NTA’s annual table. It describes representation, without attributing the differences to ability, preparation or access.
Change the denominator, then read the share
Annual unique Paper 1 candidates · NTA gender labels
Denominator: 15,38,468 unique appeared candidates. Bars start at zero; maximum 12 lakh.
The source reports these two gender rows. A share describes representation, not a cause or an individual outcome.
View the exact data
| NTA label | Registered | Appeared | Share of appeared |
|---|---|---|---|
| Male | 10,48,061 | 10,06,875 | 65.45% |
| Female | 5,56,793 | 5,31,593 | 34.55% |
Category counts describe candidates, not reserved seats.
Keep a candidate classification separate from a seat category. A category’s share of test takers is not its share of available seats and does not measure an individual student’s admission chance.
The exact table includes NTA’s separately reported candidates with benchmark disabilities (PwBD). They are already included across the category totals. Adding PwBD as another disjoint group would count some candidates twice.
Five source categories, one annual population
Unique appeared candidates · zero-based scale from 0 to 7 lakh
PwBD appeared: 4,800. This overlaps the categories above.
These are candidate counts, not percentages of seats. PwBD must not be added to the five-category total.
View the exact data
| Source category | Registered | Appeared |
|---|---|---|
| General | 5,64,457 | 5,38,239 |
| EWS | 1,83,699 | 1,80,086 |
| SC | 1,65,912 | 1,56,038 |
| ST | 55,863 | 52,152 |
| OBC | 6,34,923 | 6,11,953 |
| PwBD (overlapping) | 4,994 | 4,800 |
Find a shift. Read what its numbers actually measure.
The statistical appendix lets you inspect how candidates were scheduled across dates and shifts. Choose a session and shift to see its published scheduled total and gender split. Scheduled does not mean attended.
A large shift is not automatically a difficult shift. Nor does a shift’s percentile table give a universal raw-mark target. Read the date, session and measurement before comparing two rows.
Explore the scheduled group for a shift
19 published shifts · scheduled candidates in the statistical appendix
2026-01-21 · Shift 1 · scheduled candidates
The published percentile rows for this shift cover 1,27,973 candidate score records.
Inspect this shift’s published percentile ranges
| From | To | Candidates in row | PDF page |
|---|---|---|---|
| 100.0000000 | 100.0000000 | 1 | 4 |
| 99.0068916 | 99.9992186 | 1,307 | 4 |
| 98.0348799 | 98.9779813 | 1,287 | 4 |
| 97.0089544 | 97.9715898 | 1,342 | 4 |
| 96.0181901 | 96.9230048 | 1,273 | 5 |
| 95.0938413 | 95.9275523 | 1,228 | 5 |
| 94.0827616 | 94.9680424 | 1,334 | 5 |
| 93.0373021 | 93.9257083 | 1,367 | 5 |
| 92.1238924 | 92.8575893 | 1,223 | 6 |
| 91.0229564 | 91.9019862 | 1,420 | 6 |
| 90.0962635 | 90.7924552 | 1,240 | 6 |
| 89.0007970 | 89.8235689 | 1,397 | 6 |
| 88.0897314 | 88.7320092 | 1,209 | 7 |
| 87.1661640 | 87.7873451 | 1,222 | 7 |
| 86.1496148 | 86.8325233 | 1,268 | 7 |
| 85.0994671 | 85.8417590 | 1,476 | 7 |
| 84.3173259 | 84.6884718 | 1,004 | 8 |
| 83.4843962 | 83.9039865 | 1,208 | 8 |
| 82.0045006 | 82.9601038 | 1,857 | 8 |
| 81.0395212 | 81.5091185 | 1,369 | 8 |
| 80.4394368 | 80.4394368 | 699 | 9 |
| 79.3510025 | 79.8932662 | 1,409 | 9 |
| 78.2430342 | 78.7923302 | 1,646 | 9 |
| 77.5062118 | 77.5062118 | 790 | 9 |
| 76.2388461 | 76.8889375 | 1,680 | 10 |
| 75.5754716 | 75.5754716 | 876 | 10 |
| 74.0510384 | 74.8910003 | 2,089 | 10 |
| 73.2579582 | 73.2579582 | 1,003 | 10 |
| 72.4742542 | 72.4742542 | 984 | 11 |
| 71.7053961 | 71.7053961 | 1,055 | 11 |
| 70.8810614 | 70.8810614 | 1,394 | 11 |
| 69.7918457 | 69.7918457 | 1,241 | 11 |
| 68.8221781 | 68.8221781 | 1,164 | 12 |
| 67.9126752 | 67.9126752 | 1,186 | 12 |
| 66.0436624 | 66.9859824 | 2,889 | 12 |
| 64.7286337 | 64.7286337 | 1,408 | 12 |
| 63.6284790 | 63.6284790 | 1,366 | 13 |
| 62.5611414 | 62.5611414 | 1,405 | 13 |
| 61.4633308 | 61.4633308 | 1,383 | 13 |
| 60.3827101 | 60.3827101 | 1,955 | 13 |
| 58.8551515 | 58.8551515 | 1,628 | 14 |
| 57.5823163 | 57.5823163 | 1,599 | 14 |
| 56.3321405 | 56.3321405 | 1,603 | 14 |
| 55.0796206 | 55.0796206 | 1,560 | 14 |
| 53.8606992 | 53.8606992 | 2,359 | 15 |
| 52.0174712 | 52.0174712 | 1,823 | 15 |
| 50.5922708 | 50.5922708 | 1,713 | 15 |
| 49.2538013 | 49.2538013 | 1,808 | 15 |
| 47.8411027 | 47.8411027 | 1,737 | 16 |
| 46.4838805 | 46.4838805 | 2,667 | 16 |
| 44.3992124 | 44.3992124 | 2,006 | 16 |
| 42.8318045 | 42.8318045 | 1,951 | 17 |
| 41.3073713 | 41.3073713 | 1,833 | 17 |
| 39.8751387 | 39.8751387 | 1,824 | 17 |
| 38.4491569 | 38.4491569 | 2,852 | 17 |
| 36.2199372 | 36.2199372 | 2,165 | 17 |
| 34.5282930 | 34.5282930 | 2,007 | 18 |
| 32.9593224 | 32.9593224 | 1,905 | 18 |
| 31.4708318 | 31.4708318 | 1,934 | 18 |
| 29.9596818 | 29.9596818 | 2,800 | 19 |
| 27.7718742 | 27.7718742 | 2,093 | 19 |
| 26.1364879 | 26.1364879 | 1,976 | 19 |
| 24.5909581 | 24.5909581 | 1,807 | 19 |
| 23.1790408 | 23.1790408 | 1,750 | 20 |
| 21.8116610 | 21.8116610 | 2,712 | 20 |
| 19.6926130 | 19.6926130 | 1,885 | 20 |
| 18.2189683 | 18.2189683 | 1,777 | 20 |
| 16.8304918 | 16.8304918 | 1,536 | 21 |
| 15.6295417 | 15.6295417 | 1,466 | 21 |
| 14.4840681 | 14.4840681 | 2,209 | 21 |
| 12.7580441 | 12.7580441 | 1,543 | 22 |
| 11.5524058 | 11.5524058 | 1,390 | 22 |
| 10.4663156 | 10.4663156 | 1,279 | 22 |
| 9.4669563 | 9.4669563 | 1,055 | 22 |
| 8.6418403 | 8.6418403 | 1,969 | 23 |
| 7.1033427 | 7.1033427 | 1,047 | 23 |
| 6.2852589 | 6.2852589 | 929 | 23 |
| 5.5593755 | 5.5593755 | 778 | 23 |
| 4.4467191 | 4.9514776 | 1,738 | 24 |
| 3.1301277 | 3.5926927 | 1,050 | 24 |
| 2.1940585 | 2.7707021 | 1,349 | 24 |
| 1.0563986 | 1.7158663 | 1,213 | 24 |
| 0.0000000 | 0.7672954 | 994 | 25 |
Percentile rows cover 13,04,599 records in January and 10,34,218 in April: 54 and 112 fewer than the corresponding reported attendance. These are source-table coverage differences, not inferred zero scores or an explanation of why records differ.
Scheduled allocations differ from registered-by-shift counts elsewhere in the final release. Do not combine those sources to calculate shift attendance. Actual source percentile ranges, including singleton ranges, are retained; no missing range is filled in.
View the exact data
| Session / date / shift | Scheduled | Male | Female |
|---|---|---|---|
| 2026-01-21 · Shift 1 | 1,34,054 | 87,818 | 46,236 |
| 2026-01-21 · Shift 2 | 1,35,072 | 88,433 | 46,639 |
| 2026-01-22 · Shift 1 | 1,35,921 | 88,977 | 46,944 |
| 2026-01-22 · Shift 2 | 1,36,021 | 89,044 | 46,977 |
| 2026-01-23 · Shift 1 | 1,31,918 | 86,185 | 45,733 |
| 2026-01-23 · Shift 2 | 1,31,133 | 85,645 | 45,488 |
| 2026-01-24 · Shift 1 | 1,37,955 | 90,364 | 47,591 |
| 2026-01-24 · Shift 2 | 1,38,019 | 90,752 | 47,267 |
| 2026-01-28 · Shift 1 | 1,37,984 | 90,067 | 47,917 |
| 2026-01-28 · Shift 2 | 1,37,216 | 90,188 | 47,028 |
| 2026-04-02 · Shift 1 | 1,23,416 | 84,081 | 39,335 |
| 2026-04-02 · Shift 2 | 1,23,137 | 83,851 | 39,286 |
| 2026-04-04 · Shift 1 | 1,23,572 | 84,195 | 39,377 |
| 2026-04-04 · Shift 2 | 1,23,214 | 83,927 | 39,287 |
| 2026-04-05 · Shift 1 | 1,23,311 | 84,027 | 39,284 |
| 2026-04-05 · Shift 2 | 1,23,109 | 83,984 | 39,125 |
| 2026-04-06 · Shift 1 | 1,23,463 | 84,107 | 39,356 |
| 2026-04-06 · Shift 2 | 1,23,605 | 84,284 | 39,321 |
| 2026-04-08 · Shift 2 | 1,24,077 | 84,520 | 39,557 |
All published percentile rows by shift · works without JavaScript
2026-01-21 · Shift 1
| From | To | Candidates in row | PDF page |
|---|---|---|---|
| 100.0000000 | 100.0000000 | 1 | 4 |
| 99.0068916 | 99.9992186 | 1,307 | 4 |
| 98.0348799 | 98.9779813 | 1,287 | 4 |
| 97.0089544 | 97.9715898 | 1,342 | 4 |
| 96.0181901 | 96.9230048 | 1,273 | 5 |
| 95.0938413 | 95.9275523 | 1,228 | 5 |
| 94.0827616 | 94.9680424 | 1,334 | 5 |
| 93.0373021 | 93.9257083 | 1,367 | 5 |
| 92.1238924 | 92.8575893 | 1,223 | 6 |
| 91.0229564 | 91.9019862 | 1,420 | 6 |
| 90.0962635 | 90.7924552 | 1,240 | 6 |
| 89.0007970 | 89.8235689 | 1,397 | 6 |
| 88.0897314 | 88.7320092 | 1,209 | 7 |
| 87.1661640 | 87.7873451 | 1,222 | 7 |
| 86.1496148 | 86.8325233 | 1,268 | 7 |
| 85.0994671 | 85.8417590 | 1,476 | 7 |
| 84.3173259 | 84.6884718 | 1,004 | 8 |
| 83.4843962 | 83.9039865 | 1,208 | 8 |
| 82.0045006 | 82.9601038 | 1,857 | 8 |
| 81.0395212 | 81.5091185 | 1,369 | 8 |
| 80.4394368 | 80.4394368 | 699 | 9 |
| 79.3510025 | 79.8932662 | 1,409 | 9 |
| 78.2430342 | 78.7923302 | 1,646 | 9 |
| 77.5062118 | 77.5062118 | 790 | 9 |
| 76.2388461 | 76.8889375 | 1,680 | 10 |
| 75.5754716 | 75.5754716 | 876 | 10 |
| 74.0510384 | 74.8910003 | 2,089 | 10 |
| 73.2579582 | 73.2579582 | 1,003 | 10 |
| 72.4742542 | 72.4742542 | 984 | 11 |
| 71.7053961 | 71.7053961 | 1,055 | 11 |
| 70.8810614 | 70.8810614 | 1,394 | 11 |
| 69.7918457 | 69.7918457 | 1,241 | 11 |
| 68.8221781 | 68.8221781 | 1,164 | 12 |
| 67.9126752 | 67.9126752 | 1,186 | 12 |
| 66.0436624 | 66.9859824 | 2,889 | 12 |
| 64.7286337 | 64.7286337 | 1,408 | 12 |
| 63.6284790 | 63.6284790 | 1,366 | 13 |
| 62.5611414 | 62.5611414 | 1,405 | 13 |
| 61.4633308 | 61.4633308 | 1,383 | 13 |
| 60.3827101 | 60.3827101 | 1,955 | 13 |
| 58.8551515 | 58.8551515 | 1,628 | 14 |
| 57.5823163 | 57.5823163 | 1,599 | 14 |
| 56.3321405 | 56.3321405 | 1,603 | 14 |
| 55.0796206 | 55.0796206 | 1,560 | 14 |
| 53.8606992 | 53.8606992 | 2,359 | 15 |
| 52.0174712 | 52.0174712 | 1,823 | 15 |
| 50.5922708 | 50.5922708 | 1,713 | 15 |
| 49.2538013 | 49.2538013 | 1,808 | 15 |
| 47.8411027 | 47.8411027 | 1,737 | 16 |
| 46.4838805 | 46.4838805 | 2,667 | 16 |
| 44.3992124 | 44.3992124 | 2,006 | 16 |
| 42.8318045 | 42.8318045 | 1,951 | 17 |
| 41.3073713 | 41.3073713 | 1,833 | 17 |
| 39.8751387 | 39.8751387 | 1,824 | 17 |
| 38.4491569 | 38.4491569 | 2,852 | 17 |
| 36.2199372 | 36.2199372 | 2,165 | 17 |
| 34.5282930 | 34.5282930 | 2,007 | 18 |
| 32.9593224 | 32.9593224 | 1,905 | 18 |
| 31.4708318 | 31.4708318 | 1,934 | 18 |
| 29.9596818 | 29.9596818 | 2,800 | 19 |
| 27.7718742 | 27.7718742 | 2,093 | 19 |
| 26.1364879 | 26.1364879 | 1,976 | 19 |
| 24.5909581 | 24.5909581 | 1,807 | 19 |
| 23.1790408 | 23.1790408 | 1,750 | 20 |
| 21.8116610 | 21.8116610 | 2,712 | 20 |
| 19.6926130 | 19.6926130 | 1,885 | 20 |
| 18.2189683 | 18.2189683 | 1,777 | 20 |
| 16.8304918 | 16.8304918 | 1,536 | 21 |
| 15.6295417 | 15.6295417 | 1,466 | 21 |
| 14.4840681 | 14.4840681 | 2,209 | 21 |
| 12.7580441 | 12.7580441 | 1,543 | 22 |
| 11.5524058 | 11.5524058 | 1,390 | 22 |
| 10.4663156 | 10.4663156 | 1,279 | 22 |
| 9.4669563 | 9.4669563 | 1,055 | 22 |
| 8.6418403 | 8.6418403 | 1,969 | 23 |
| 7.1033427 | 7.1033427 | 1,047 | 23 |
| 6.2852589 | 6.2852589 | 929 | 23 |
| 5.5593755 | 5.5593755 | 778 | 23 |
| 4.4467191 | 4.9514776 | 1,738 | 24 |
| 3.1301277 | 3.5926927 | 1,050 | 24 |
| 2.1940585 | 2.7707021 | 1,349 | 24 |
| 1.0563986 | 1.7158663 | 1,213 | 24 |
| 0.0000000 | 0.7672954 | 994 | 25 |
2026-01-21 · Shift 2
| From | To | Candidates in row | PDF page |
|---|---|---|---|
| 100.0000000 | 100.0000000 | 1 | 4 |
| 99.0331406 | 99.9992271 | 1,292 | 4 |
| 98.0129533 | 98.9968158 | 1,355 | 4 |
| 97.0538226 | 97.9480323 | 1,241 | 4 |
| 96.0923733 | 96.9889016 | 1,296 | 5 |
| 95.1015550 | 95.9872631 | 1,292 | 5 |
| 94.0373141 | 94.9887161 | 1,415 | 5 |
| 93.1083253 | 93.8951062 | 1,238 | 5 |
| 92.0912295 | 92.9382941 | 1,341 | 6 |
| 91.1174143 | 91.9018765 | 1,242 | 6 |
| 90.1080471 | 90.9412001 | 1,364 | 6 |
| 89.1705568 | 89.8870065 | 1,241 | 6 |
| 88.1689183 | 88.9271030 | 1,300 | 7 |
| 87.1541410 | 87.9223730 | 1,345 | 7 |
| 86.2398368 | 86.8828639 | 1,239 | 7 |
| 85.3123937 | 85.9245061 | 1,234 | 7 |
| 84.2852506 | 84.9707855 | 1,312 | 8 |
| 83.2465144 | 83.9567812 | 1,476 | 8 |
| 82.0292454 | 82.8160262 | 1,551 | 8 |
| 81.1690420 | 81.6173061 | 1,181 | 8 |
| 80.2292330 | 80.7045476 | 1,233 | 9 |
| 79.2778310 | 79.7515998 | 1,197 | 9 |
| 78.1927227 | 78.8264754 | 1,550 | 9 |
| 77.0890654 | 77.6277553 | 1,399 | 9 |
| 76.5465113 | 76.5465113 | 732 | 10 |
| 75.2287693 | 75.9807710 | 1,803 | 10 |
| 74.5872878 | 74.5872878 | 824 | 10 |
| 73.3089622 | 73.9504436 | 1,697 | 10 |
| 72.6388846 | 72.6388846 | 1,252 | 11 |
| 71.6704795 | 71.6704795 | 1,074 | 11 |
| 70.0111293 | 70.8404180 | 2,145 | 11 |
| 69.1826135 | 69.1826135 | 1,054 | 11 |
| 68.3680094 | 68.3680094 | 1,479 | 12 |
| 67.2249359 | 67.2249359 | 1,327 | 12 |
| 66.1993384 | 66.1993384 | 1,237 | 12 |
| 65.2432992 | 65.2432992 | 1,343 | 12 |
| 64.2045630 | 64.2045630 | 1,350 | 12 |
| 63.1604167 | 63.1604167 | 2,014 | 13 |
| 61.6038582 | 61.6038582 | 1,579 | 13 |
| 60.3834977 | 60.3834977 | 1,580 | 13 |
| 59.1623644 | 59.1623644 | 1,559 | 13 |
| 57.9574613 | 57.9574613 | 1,531 | 14 |
| 56.7741985 | 56.7741985 | 2,318 | 14 |
| 54.9826877 | 54.9826877 | 1,881 | 14 |
| 53.5289208 | 53.5289208 | 1,857 | 15 |
| 52.0937027 | 52.0937027 | 1,876 | 15 |
| 50.6438000 | 50.6438000 | 1,839 | 15 |
| 49.2224936 | 49.2224936 | 2,780 | 15 |
| 47.0739172 | 47.0739172 | 2,146 | 16 |
| 45.4153399 | 45.4153399 | 2,070 | 16 |
| 43.8147278 | 43.8147278 | 2,098 | 16 |
| 42.1932482 | 42.1932482 | 2,005 | 17 |
| 40.6436455 | 40.6436455 | 3,087 | 17 |
| 38.2577983 | 38.2577983 | 2,321 | 17 |
| 36.4631960 | 36.4631960 | 2,162 | 17 |
| 34.7922528 | 34.7922528 | 2,215 | 18 |
| 33.0803475 | 33.0803475 | 2,114 | 18 |
| 31.4465020 | 31.4465020 | 3,162 | 18 |
| 29.0026896 | 29.0026896 | 2,345 | 19 |
| 27.1903113 | 27.1903113 | 2,218 | 19 |
| 25.4760874 | 25.4760874 | 2,145 | 19 |
| 23.8182830 | 23.8182830 | 1,959 | 20 |
| 22.3042322 | 22.3042322 | 3,052 | 20 |
| 19.9446626 | 19.9446626 | 2,224 | 20 |
| 18.2258015 | 18.2258015 | 1,918 | 20 |
| 16.7434383 | 16.7434383 | 1,680 | 21 |
| 15.4450181 | 15.4450181 | 1,548 | 21 |
| 14.2486166 | 14.2486166 | 2,635 | 21 |
| 12.2121062 | 12.2121062 | 1,628 | 22 |
| 10.9538752 | 10.9538752 | 1,336 | 22 |
| 9.9213219 | 9.9213219 | 1,251 | 22 |
| 8.1089436 | 8.9536897 | 2,791 | 23 |
| 6.0577488 | 6.7958389 | 1,760 | 23 |
| 5.4348162 | 5.4348162 | 699 | 23 |
| 4.4154017 | 4.8938078 | 1,697 | 24 |
| 3.1664451 | 3.5814759 | 1,002 | 24 |
| 2.2869200 | 2.8070609 | 1,368 | 24 |
| 1.1191146 | 1.7497759 | 1,200 | 24 |
| 0.0000000 | 0.8223328 | 1,074 | 25 |
2026-01-22 · Shift 1
| From | To | Candidates in row | PDF page |
|---|---|---|---|
| 100.0000000 | 100.0000000 | 1 | 4 |
| 99.0018030 | 99.9992327 | 1,336 | 4 |
| 98.0488741 | 98.9726474 | 1,290 | 4 |
| 97.0606514 | 97.9828902 | 1,315 | 4 |
| 96.0478766 | 96.9739517 | 1,352 | 5 |
| 95.0895769 | 95.9366249 | 1,286 | 5 |
| 94.0929144 | 94.9499367 | 1,311 | 5 |
| 93.1169678 | 93.9440672 | 1,346 | 5 |
| 92.1364177 | 92.9113438 | 1,268 | 6 |
| 91.0614954 | 91.9384663 | 1,423 | 6 |
| 90.1469291 | 90.8466644 | 1,238 | 6 |
| 89.1111367 | 89.8968044 | 1,357 | 6 |
| 88.2571834 | 88.8556412 | 1,194 | 7 |
| 87.3395481 | 87.9395404 | 1,232 | 7 |
| 86.2776691 | 86.9942840 | 1,389 | 7 |
| 85.1283232 | 85.9285687 | 1,591 | 7 |
| 84.2943185 | 84.7078682 | 1,094 | 8 |
| 83.4303909 | 83.8684927 | 1,318 | 8 |
| 82.3454943 | 82.8572525 | 1,322 | 8 |
| 81.3419266 | 81.8429432 | 1,356 | 8 |
| 80.0943722 | 80.8025473 | 1,741 | 9 |
| 79.4667587 | 79.4667587 | 862 | 9 |
| 78.1800744 | 78.8053861 | 1,624 | 9 |
| 77.5593662 | 77.5593662 | 1,176 | 9 |
| 76.6570760 | 76.6570760 | 998 | 10 |
| 75.1586297 | 75.8913569 | 1,983 | 10 |
| 74.3691257 | 74.3691257 | 1,053 | 10 |
| 73.5612077 | 73.5612077 | 1,620 | 10 |
| 72.3182568 | 72.3182568 | 1,357 | 11 |
| 71.2770936 | 71.2770936 | 1,312 | 11 |
| 70.2704569 | 70.2704569 | 1,333 | 11 |
| 69.2477078 | 69.2477078 | 1,351 | 11 |
| 68.2111482 | 68.2111482 | 1,963 | 12 |
| 66.7050293 | 66.7050293 | 1,688 | 12 |
| 65.4099052 | 65.4099052 | 1,588 | 12 |
| 64.1915065 | 64.1915065 | 1,666 | 12 |
| 62.9132620 | 62.9132620 | 1,556 | 13 |
| 61.7194154 | 61.7194154 | 2,428 | 13 |
| 59.8565236 | 59.8565236 | 2,074 | 13 |
| 58.2652396 | 58.2652396 | 1,970 | 14 |
| 56.7537500 | 56.7537500 | 1,975 | 14 |
| 55.2384241 | 55.2384241 | 2,048 | 14 |
| 53.6670887 | 53.6670887 | 2,857 | 15 |
| 51.4750451 | 51.4750451 | 2,428 | 15 |
| 49.6121533 | 49.6121533 | 2,285 | 15 |
| 47.8574443 | 47.8574443 | 2,208 | 16 |
| 46.1625810 | 46.1625810 | 2,227 | 16 |
| 44.4539072 | 44.4539072 | 3,145 | 16 |
| 42.0408946 | 42.0408946 | 2,744 | 17 |
| 39.9355507 | 39.9355507 | 2,442 | 17 |
| 38.0619174 | 38.0619174 | 2,470 | 17 |
| 36.1660337 | 36.1660337 | 2,373 | 17 |
| 34.3453409 | 34.3453409 | 3,288 | 18 |
| 31.8210765 | 31.8210765 | 2,693 | 18 |
| 29.7540952 | 29.7540952 | 2,458 | 19 |
| 27.8681858 | 27.8681858 | 2,354 | 19 |
| 26.0620708 | 26.0620708 | 2,278 | 19 |
| 24.3134998 | 24.3134998 | 3,042 | 19 |
| 21.9795143 | 21.9795143 | 2,410 | 20 |
| 20.1304331 | 20.1304331 | 2,193 | 20 |
| 18.4478459 | 18.4478459 | 2,082 | 20 |
| 16.8496567 | 16.8496567 | 1,845 | 21 |
| 15.4340737 | 15.4340737 | 2,513 | 21 |
| 13.5059654 | 13.5059654 | 2,165 | 21 |
| 11.8440941 | 11.8440941 | 1,552 | 22 |
| 10.6533165 | 10.6533165 | 1,455 | 22 |
| 9.5369624 | 9.5369624 | 1,252 | 22 |
| 8.5748264 | 8.5748264 | 1,765 | 23 |
| 7.2198565 | 7.2198565 | 1,256 | 23 |
| 6.2561860 | 6.2561860 | 940 | 23 |
| 5.5349676 | 5.5349676 | 809 | 23 |
| 4.4117083 | 4.9142594 | 1,725 | 24 |
| 3.0989374 | 3.5907469 | 1,126 | 24 |
| 2.1659570 | 2.7268194 | 1,409 | 24 |
| 1.1263283 | 1.6457590 | 842 | 24 |
| 0.0000000 | 0.9997315 | 1,317 | 25 |
2026-01-22 · Shift 2
| From | To | Candidates in row | PDF page |
|---|---|---|---|
| 100.0000000 | 100.0000000 | 1 | 4 |
| 99.0337870 | 99.9992380 | 1,311 | 4 |
| 98.0043281 | 98.9994971 | 1,385 | 4 |
| 97.0571651 | 97.9433683 | 1,285 | 4 |
| 96.0063703 | 96.9619154 | 1,424 | 5 |
| 95.0797812 | 95.8753067 | 1,218 | 5 |
| 94.0838502 | 94.9464316 | 1,388 | 5 |
| 93.1199232 | 93.8887788 | 1,317 | 5 |
| 92.2276239 | 92.8852279 | 1,195 | 6 |
| 91.2385510 | 91.9746407 | 1,354 | 6 |
| 90.0612646 | 90.9428959 | 1,522 | 6 |
| 89.0912416 | 89.7831355 | 1,394 | 6 |
| 88.0396848 | 88.7209107 | 1,463 | 7 |
| 87.1778655 | 87.6061082 | 1,098 | 7 |
| 86.3602420 | 86.7694348 | 1,080 | 7 |
| 85.4184129 | 85.9464773 | 1,375 | 7 |
| 84.3820961 | 84.8987305 | 1,360 | 8 |
| 83.3053934 | 83.8624137 | 1,589 | 8 |
| 82.6515994 | 82.6515994 | 870 | 8 |
| 81.3546794 | 81.9886615 | 1,650 | 8 |
| 80.0356615 | 80.7313653 | 2,038 | 9 |
| 79.1784141 | 79.1784141 | 1,064 | 9 |
| 78.3676486 | 78.3676486 | 1,030 | 9 |
| 77.5827910 | 77.5827910 | 1,103 | 9 |
| 76.7423076 | 76.7423076 | 1,053 | 10 |
| 75.9399241 | 75.9399241 | 1,455 | 10 |
| 74.8312175 | 74.8312175 | 1,291 | 10 |
| 73.8474785 | 73.8474785 | 1,291 | 10 |
| 72.8637396 | 72.8637396 | 1,382 | 11 |
| 71.8106588 | 71.8106588 | 1,412 | 11 |
| 70.7347181 | 70.7347181 | 1,833 | 11 |
| 69.3379764 | 69.3379764 | 1,568 | 11 |
| 68.1431641 | 68.1431641 | 1,580 | 12 |
| 66.9392078 | 66.9392078 | 1,684 | 12 |
| 65.6552418 | 65.6552418 | 1,630 | 12 |
| 64.4131856 | 64.4131856 | 2,150 | 12 |
| 62.7748907 | 62.7748907 | 1,903 | 13 |
| 61.3248091 | 61.3248091 | 1,996 | 13 |
| 59.8038618 | 59.8038618 | 1,973 | 13 |
| 58.3004404 | 58.3004404 | 1,911 | 14 |
| 56.8435009 | 56.8435009 | 2,497 | 14 |
| 54.9400308 | 54.9400308 | 2,268 | 14 |
| 53.2118201 | 53.2118201 | 2,263 | 15 |
| 51.4874194 | 51.4874194 | 2,263 | 15 |
| 49.7630187 | 49.7630187 | 2,165 | 15 |
| 48.1132938 | 48.1132938 | 2,786 | 16 |
| 45.9903683 | 45.9903683 | 2,482 | 16 |
| 44.0990902 | 44.0990902 | 2,430 | 16 |
| 42.2474359 | 42.2474359 | 2,529 | 17 |
| 40.3195818 | 40.3195818 | 2,371 | 17 |
| 38.5128854 | 38.5128854 | 2,921 | 17 |
| 36.2870902 | 36.2870902 | 2,508 | 17 |
| 34.3760001 | 34.3760001 | 2,459 | 18 |
| 32.5014859 | 32.5014859 | 2,384 | 18 |
| 30.6848835 | 30.6848835 | 2,264 | 18 |
| 28.9597208 | 28.9597208 | 2,827 | 19 |
| 26.8055534 | 26.8055534 | 2,381 | 19 |
| 24.9912370 | 24.9912370 | 2,263 | 19 |
| 23.2668363 | 23.2668363 | 2,225 | 20 |
| 21.5713916 | 21.5713916 | 2,047 | 20 |
| 20.0108204 | 20.0108204 | 2,569 | 20 |
| 18.0532484 | 18.0532484 | 1,993 | 20 |
| 16.5345871 | 16.5345871 | 1,896 | 21 |
| 15.0898395 | 15.0898395 | 1,784 | 21 |
| 13.7304357 | 13.7304357 | 1,562 | 21 |
| 12.5401954 | 12.5401954 | 2,106 | 22 |
| 10.9354283 | 10.9354283 | 1,450 | 22 |
| 9.8305317 | 9.8305317 | 1,334 | 22 |
| 8.8140269 | 8.8140269 | 1,481 | 23 |
| 7.6855083 | 7.6855083 | 1,050 | 23 |
| 6.8854108 | 6.8854108 | 1,420 | 23 |
| 5.0992883 | 5.8033741 | 1,739 | 23 |
| 4.4774982 | 4.4774982 | 647 | 24 |
| 3.5234771 | 3.9844857 | 1,411 | 24 |
| 2.0071018 | 2.9093070 | 1,466 | 24 |
| 1.0698447 | 1.7922185 | 1,100 | 24 |
| 0.0000000 | 0.9540211 | 1,259 | 25 |
2026-01-23 · Shift 1
| From | To | Candidates in row | PDF page |
|---|---|---|---|
| 100.0000000 | 100.0000000 | 1 | 4 |
| 99.0287832 | 99.9992149 | 1,277 | 4 |
| 98.0599218 | 98.9958074 | 1,276 | 4 |
| 97.0635805 | 97.9931850 | 1,317 | 4 |
| 96.0232715 | 96.9591571 | 1,344 | 5 |
| 95.0654021 | 95.9031453 | 1,251 | 5 |
| 94.1012515 | 94.9209365 | 1,231 | 5 |
| 93.1174725 | 93.9536454 | 1,291 | 5 |
| 92.1925789 | 92.9400311 | 1,213 | 6 |
| 91.1530550 | 91.9876576 | 1,314 | 6 |
| 90.0067522 | 90.9552000 | 1,579 | 6 |
| 89.2082659 | 89.7154657 | 1,018 | 6 |
| 88.3014305 | 88.9161943 | 1,172 | 7 |
| 87.3239326 | 87.9960115 | 1,283 | 7 |
| 86.2506477 | 86.9886783 | 1,381 | 7 |
| 85.1326100 | 85.9036163 | 1,594 | 7 |
| 84.1841622 | 84.6521050 | 1,205 | 8 |
| 83.2286481 | 83.7052275 | 1,161 | 8 |
| 82.2228852 | 82.7936812 | 1,429 | 8 |
| 81.0679459 | 81.6717177 | 1,472 | 8 |
| 80.5159933 | 80.5159933 | 702 | 9 |
| 79.2322912 | 79.9648258 | 1,823 | 9 |
| 78.5335176 | 78.5335176 | 844 | 9 |
| 77.1548137 | 77.8708604 | 1,802 | 9 |
| 76.4560401 | 76.4560401 | 1,208 | 10 |
| 75.5075923 | 75.5075923 | 1,133 | 10 |
| 74.6172448 | 74.6172448 | 1,082 | 10 |
| 73.7677245 | 73.7677245 | 1,137 | 10 |
| 72.8750216 | 72.8750216 | 1,122 | 11 |
| 71.9940958 | 71.9940958 | 1,572 | 11 |
| 70.7598574 | 70.7598574 | 1,443 | 11 |
| 69.6269020 | 69.6269020 | 1,379 | 11 |
| 68.5441955 | 68.5441955 | 1,394 | 12 |
| 67.4497119 | 67.4497119 | 1,388 | 12 |
| 66.3599391 | 66.3599391 | 2,002 | 12 |
| 64.7880910 | 64.7880910 | 1,724 | 12 |
| 63.4345116 | 63.4345116 | 1,655 | 13 |
| 62.1351067 | 62.1351067 | 1,731 | 13 |
| 60.7760313 | 60.7760313 | 1,678 | 13 |
| 59.4585682 | 59.4585682 | 2,234 | 13 |
| 57.7045679 | 57.7045679 | 2,125 | 14 |
| 56.0353627 | 56.0353627 | 1,974 | 14 |
| 54.4854985 | 54.4854985 | 2,091 | 14 |
| 52.8437731 | 52.8437731 | 2,002 | 15 |
| 51.2719250 | 51.2719250 | 2,762 | 15 |
| 49.1025862 | 49.1025862 | 2,450 | 15 |
| 47.1789960 | 47.1789960 | 2,295 | 16 |
| 45.3771022 | 45.3771022 | 2,283 | 16 |
| 43.5846301 | 43.5846301 | 2,315 | 16 |
| 41.7654633 | 41.7654633 | 2,921 | 17 |
| 39.4720726 | 39.4720726 | 2,717 | 17 |
| 37.3372800 | 37.3372800 | 2,413 | 17 |
| 35.4427398 | 35.4427398 | 2,360 | 18 |
| 33.5898120 | 33.5898120 | 2,211 | 18 |
| 31.8538699 | 31.8538699 | 3,086 | 18 |
| 29.4309313 | 29.4309313 | 2,638 | 19 |
| 27.3597349 | 27.3597349 | 2,243 | 19 |
| 25.5986684 | 25.5986684 | 2,230 | 19 |
| 23.8478087 | 23.8478087 | 2,152 | 20 |
| 22.1581898 | 22.1581898 | 2,789 | 20 |
| 19.9684374 | 19.9684374 | 2,336 | 20 |
| 18.1343530 | 18.1343530 | 2,031 | 20 |
| 16.5397359 | 16.5397359 | 1,830 | 21 |
| 15.1029317 | 15.1029317 | 1,702 | 21 |
| 13.7666253 | 13.7666253 | 2,197 | 21 |
| 12.0416752 | 12.0416752 | 1,925 | 22 |
| 10.5294977 | 10.5294977 | 1,447 | 22 |
| 9.3934017 | 9.3934017 | 1,281 | 22 |
| 8.3876388 | 8.3876388 | 1,009 | 23 |
| 7.5954336 | 7.5954336 | 1,545 | 23 |
| 6.3823940 | 6.3823940 | 1,083 | 23 |
| 5.5320886 | 5.5320886 | 861 | 23 |
| 4.3449586 | 4.8560840 | 1,267 | 24 |
| 3.1397704 | 3.8613131 | 1,493 | 24 |
| 2.0562788 | 2.6891007 | 1,112 | 24 |
| 1.0379536 | 1.8160263 | 1,151 | 24 |
| 0.0000000 | 0.9123314 | 1,171 | 25 |
2026-01-23 · Shift 2
| From | To | Candidates in row | PDF page |
|---|---|---|---|
| 100.0000000 | 100.0000000 | 1 | 4 |
| 99.0202111 | 99.9992111 | 1,278 | 4 |
| 98.0475221 | 98.9894448 | 1,264 | 4 |
| 97.0708888 | 97.9915117 | 1,261 | 4 |
| 96.0863666 | 96.9951563 | 1,278 | 5 |
| 95.0434673 | 95.9846011 | 1,357 | 5 |
| 94.0723561 | 94.9140910 | 1,270 | 5 |
| 93.0791562 | 93.9114246 | 1,289 | 5 |
| 92.1151449 | 92.8945583 | 1,235 | 6 |
| 91.0698790 | 91.9202916 | 1,352 | 6 |
| 90.1413673 | 90.8529370 | 1,233 | 6 |
| 89.0164245 | 89.8802480 | 1,474 | 6 |
| 88.0587242 | 88.7174390 | 1,288 | 7 |
| 87.0442246 | 87.7005727 | 1,310 | 7 |
| 86.3113551 | 86.6671400 | 941 | 7 |
| 85.1722125 | 85.9248040 | 1,551 | 7 |
| 84.2066234 | 84.7012512 | 1,209 | 8 |
| 83.2781117 | 83.7474953 | 1,237 | 8 |
| 82.1602689 | 82.7708619 | 1,528 | 8 |
| 81.0037708 | 81.5654534 | 1,446 | 8 |
| 80.4247330 | 80.4247330 | 752 | 9 |
| 79.1025702 | 79.8314952 | 1,824 | 9 |
| 78.3917893 | 78.3917893 | 895 | 9 |
| 77.0491157 | 77.6857418 | 1,694 | 9 |
| 76.3493792 | 76.3493792 | 1,238 | 10 |
| 75.3727458 | 75.3727458 | 1,021 | 10 |
| 74.5672993 | 74.5672993 | 1,088 | 10 |
| 73.7089980 | 73.7089980 | 1,116 | 10 |
| 72.8286079 | 72.8286079 | 1,187 | 11 |
| 71.8922074 | 71.8922074 | 1,565 | 11 |
| 70.6576103 | 70.6576103 | 1,388 | 11 |
| 69.5618561 | 69.5618561 | 1,409 | 11 |
| 68.4503242 | 68.4503242 | 1,362 | 12 |
| 67.3758697 | 67.3758697 | 1,391 | 12 |
| 66.2785377 | 66.2785377 | 1,948 | 12 |
| 64.7410107 | 64.7410107 | 1,669 | 12 |
| 63.4243701 | 63.4243701 | 1,665 | 13 |
| 62.1108850 | 62.1108850 | 1,649 | 13 |
| 60.8100219 | 60.8100219 | 1,653 | 13 |
| 59.5060034 | 59.5060034 | 2,240 | 13 |
| 57.7389123 | 57.7389123 | 2,099 | 14 |
| 56.0830533 | 56.0830533 | 1,838 | 14 |
| 54.6330919 | 54.6330919 | 1,917 | 14 |
| 53.1208091 | 53.1208091 | 1,928 | 15 |
| 51.5998485 | 51.5998485 | 2,633 | 15 |
| 49.5227276 | 49.5227276 | 2,339 | 15 |
| 47.6775374 | 47.6775374 | 2,270 | 16 |
| 45.8867799 | 45.8867799 | 2,145 | 16 |
| 44.1946325 | 44.1946325 | 2,148 | 16 |
| 42.5001183 | 42.5001183 | 2,868 | 17 |
| 40.2376106 | 40.2376106 | 2,557 | 17 |
| 38.2204446 | 38.2204446 | 2,396 | 17 |
| 36.3302883 | 36.3302883 | 2,362 | 17 |
| 34.4661649 | 34.4661649 | 2,195 | 18 |
| 32.7345735 | 32.7345735 | 2,868 | 18 |
| 30.4720658 | 30.4720658 | 2,507 | 18 |
| 28.4943437 | 28.4943437 | 2,374 | 19 |
| 26.6199650 | 26.6199650 | 2,255 | 19 |
| 24.8410407 | 24.8410407 | 2,148 | 19 |
| 23.1465266 | 23.1465266 | 2,694 | 20 |
| 21.0212840 | 21.0212840 | 2,245 | 20 |
| 19.2494596 | 19.2494596 | 2,058 | 20 |
| 17.6259447 | 17.6259447 | 1,968 | 21 |
| 16.0734289 | 16.0734289 | 1,813 | 21 |
| 14.6431896 | 14.6431896 | 2,151 | 21 |
| 12.9463088 | 12.9463088 | 1,775 | 22 |
| 11.5460469 | 11.5460469 | 1,759 | 22 |
| 10.1584071 | 10.1584071 | 1,442 | 22 |
| 9.0208422 | 9.0208422 | 1,225 | 22 |
| 8.0544643 | 8.0544643 | 1,605 | 23 |
| 6.7883120 | 6.7883120 | 1,124 | 23 |
| 5.1584860 | 5.9016109 | 1,763 | 23 |
| 4.5100267 | 4.5100267 | 680 | 24 |
| 3.2036415 | 3.9735883 | 1,531 | 24 |
| 2.0865875 | 2.7658131 | 1,165 | 24 |
| 1.0405327 | 1.8467680 | 1,213 | 24 |
| 0.0000000 | 0.8898566 | 1,137 | 25 |
2026-01-24 · Shift 1
| From | To | Candidates in row | PDF page |
|---|---|---|---|
| 100.0000000 | 100.0000000 | 1 | 4 |
| 99.0313262 | 99.9992497 | 1,338 | 4 |
| 98.0498968 | 98.9938098 | 1,338 | 4 |
| 97.0534609 | 97.9898706 | 1,361 | 4 |
| 96.0450197 | 96.9686738 | 1,365 | 5 |
| 95.0050647 | 95.9444757 | 1,441 | 5 |
| 94.1481898 | 94.8632527 | 1,151 | 5 |
| 93.0422060 | 93.9996248 | 1,513 | 5 |
| 92.0990433 | 92.8643782 | 1,256 | 6 |
| 91.0913525 | 91.9219659 | 1,385 | 6 |
| 90.1752017 | 90.8827612 | 1,237 | 6 |
| 89.1990246 | 89.9546051 | 1,308 | 6 |
| 88.1695742 | 88.9731758 | 1,446 | 7 |
| 87.3029450 | 87.8882011 | 1,197 | 7 |
| 86.2862502 | 86.9900582 | 1,382 | 7 |
| 85.2748077 | 85.9531045 | 1,464 | 7 |
| 84.0630276 | 84.8546239 | 1,569 | 8 |
| 83.2781842 | 83.6773588 | 1,196 | 8 |
| 82.3170137 | 82.7799662 | 1,219 | 8 |
| 81.3978616 | 81.8645657 | 1,213 | 8 |
| 80.3226412 | 80.9544176 | 1,593 | 9 |
| 79.2106547 | 79.7591446 | 1,462 | 9 |
| 78.1241793 | 78.6621647 | 1,748 | 9 |
| 77.3505909 | 77.3505909 | 910 | 9 |
| 76.6677922 | 76.6677922 | 898 | 10 |
| 75.3111986 | 75.9939974 | 1,814 | 10 |
| 74.6329019 | 74.6329019 | 1,304 | 10 |
| 73.6544738 | 73.6544738 | 1,056 | 10 |
| 72.0457700 | 72.8621272 | 2,169 | 11 |
| 71.2339148 | 71.2339148 | 1,114 | 11 |
| 70.3980491 | 70.3980491 | 1,562 | 11 |
| 69.2260364 | 69.2260364 | 1,317 | 11 |
| 68.2378541 | 68.2378541 | 1,331 | 12 |
| 67.2391671 | 67.2391671 | 1,360 | 12 |
| 66.2187207 | 66.2187207 | 1,424 | 12 |
| 65.1502532 | 65.1502532 | 2,102 | 12 |
| 63.5730632 | 63.5730632 | 1,688 | 13 |
| 62.3065091 | 62.3065091 | 1,599 | 13 |
| 61.1067342 | 61.1067342 | 1,535 | 13 |
| 59.9549803 | 59.9549803 | 1,581 | 13 |
| 58.7687113 | 58.7687113 | 2,489 | 14 |
| 56.9011443 | 56.9011443 | 1,959 | 14 |
| 55.4312512 | 55.4312512 | 1,933 | 14 |
| 53.9808666 | 53.9808666 | 1,981 | 15 |
| 52.4944663 | 52.4944663 | 1,865 | 15 |
| 51.0951041 | 51.0951041 | 2,907 | 15 |
| 48.9138998 | 48.9138998 | 2,203 | 16 |
| 47.2609267 | 47.2609267 | 2,241 | 16 |
| 45.5794410 | 45.5794410 | 2,119 | 16 |
| 43.9894954 | 43.9894954 | 2,002 | 16 |
| 42.4873382 | 42.4873382 | 3,082 | 17 |
| 40.1740762 | 40.1740762 | 2,386 | 17 |
| 38.3837929 | 38.3837929 | 2,309 | 17 |
| 36.6512849 | 36.6512849 | 2,278 | 17 |
| 34.9420371 | 34.9420371 | 2,077 | 18 |
| 33.3836053 | 33.3836053 | 3,179 | 18 |
| 30.9983118 | 30.9983118 | 2,477 | 18 |
| 29.1397486 | 29.1397486 | 2,245 | 19 |
| 27.4552617 | 27.4552617 | 2,169 | 19 |
| 25.8270493 | 25.8270493 | 2,082 | 19 |
| 24.2648659 | 24.2648659 | 2,964 | 19 |
| 22.0401426 | 22.0401426 | 2,224 | 20 |
| 20.3706622 | 20.3706622 | 2,051 | 20 |
| 18.8317389 | 18.8317389 | 1,846 | 20 |
| 17.4466329 | 17.4466329 | 1,740 | 21 |
| 16.1410617 | 16.1410617 | 2,688 | 21 |
| 14.1241793 | 14.1241793 | 1,846 | 21 |
| 12.7390733 | 12.7390733 | 1,667 | 22 |
| 11.4867755 | 11.4867755 | 1,530 | 22 |
| 10.3380229 | 10.3380229 | 1,256 | 22 |
| 9.3956106 | 9.3956106 | 2,178 | 22 |
| 7.7613956 | 7.7613956 | 1,252 | 23 |
| 6.0048771 | 6.8219846 | 2,009 | 23 |
| 5.3145751 | 5.3145751 | 805 | 23 |
| 4.7105609 | 4.7105609 | 1,209 | 24 |
| 3.2624273 | 3.8034140 | 1,264 | 24 |
| 2.2022135 | 2.8549991 | 1,555 | 24 |
| 1.0789721 | 1.6882386 | 990 | 24 |
| 0.0000000 | 0.9454136 | 1,269 | 25 |
2026-01-24 · Shift 2
| From | To | Candidates in row | PDF page |
|---|---|---|---|
| 100.0000000 | 100.0000000 | 3 | 4 |
| 99.0006443 | 99.9977526 | 1,366 | 4 |
| 98.0409931 | 98.9729260 | 1,313 | 4 |
| 97.0701047 | 97.9885531 | 1,336 | 4 |
| 96.0220547 | 96.9876991 | 1,423 | 5 |
| 95.0286921 | 95.9216697 | 1,369 | 5 |
| 94.0735358 | 94.8960940 | 1,343 | 5 |
| 93.1063932 | 93.8899960 | 1,276 | 5 |
| 92.1632231 | 92.9340905 | 1,291 | 6 |
| 91.1196680 | 91.9669478 | 1,479 | 6 |
| 90.1180648 | 90.8589665 | 1,371 | 6 |
| 89.2842695 | 89.8318925 | 1,126 | 6 |
| 88.0391951 | 88.9883583 | 1,730 | 7 |
| 87.0106228 | 87.6923423 | 1,510 | 7 |
| 86.1468618 | 86.5611375 | 1,104 | 7 |
| 85.3392865 | 85.7340845 | 1,064 | 7 |
| 84.3609068 | 84.9362480 | 1,436 | 8 |
| 83.3922659 | 83.8604798 | 1,258 | 8 |
| 82.4176318 | 82.9180588 | 1,634 | 8 |
| 81.0691758 | 81.6939604 | 1,586 | 8 |
| 80.5058208 | 80.5058208 | 830 | 9 |
| 79.2749801 | 79.8840328 | 2,094 | 9 |
| 78.3153289 | 78.3153289 | 983 | 9 |
| 77.5789221 | 77.5789221 | 985 | 9 |
| 76.0896274 | 76.8410170 | 2,115 | 10 |
| 75.2558321 | 75.2558321 | 1,632 | 10 |
| 74.0332319 | 74.0332319 | 1,302 | 10 |
| 73.0578488 | 73.0578488 | 1,256 | 10 |
| 72.1169261 | 72.1169261 | 1,281 | 11 |
| 71.1572749 | 71.1572749 | 1,361 | 11 |
| 70.1376923 | 70.1376923 | 2,011 | 11 |
| 68.6311673 | 68.6311673 | 1,567 | 12 |
| 67.4572614 | 67.4572614 | 1,546 | 12 |
| 66.2983384 | 66.2983384 | 1,532 | 12 |
| 65.1506525 | 65.1506525 | 1,676 | 12 |
| 63.8943410 | 63.8943410 | 2,435 | 13 |
| 62.0701796 | 62.0701796 | 1,952 | 13 |
| 60.6078540 | 60.6078540 | 1,877 | 13 |
| 59.2017140 | 59.2017140 | 1,913 | 13 |
| 57.7678558 | 57.7678558 | 1,947 | 14 |
| 56.3092759 | 56.3092759 | 2,923 | 14 |
| 54.1187840 | 54.1187840 | 2,300 | 14 |
| 52.3957569 | 52.3957569 | 2,136 | 15 |
| 50.7955891 | 50.7955891 | 2,150 | 15 |
| 49.1849333 | 49.1849333 | 2,239 | 15 |
| 47.5068547 | 47.5068547 | 3,183 | 16 |
| 45.1223349 | 45.1223349 | 2,499 | 16 |
| 43.2502285 | 43.2502285 | 2,366 | 16 |
| 41.4777580 | 41.4777580 | 2,338 | 17 |
| 39.7262634 | 39.7262634 | 2,493 | 17 |
| 37.8586518 | 37.8586518 | 3,383 | 17 |
| 35.3235545 | 35.3235545 | 2,569 | 18 |
| 33.3982590 | 33.3982590 | 2,355 | 18 |
| 31.6340290 | 31.6340290 | 2,312 | 18 |
| 29.9012631 | 29.9012631 | 2,410 | 19 |
| 28.0958303 | 28.0958303 | 3,111 | 19 |
| 25.7652488 | 25.7652488 | 2,434 | 19 |
| 23.9418366 | 23.9418366 | 2,300 | 20 |
| 22.2188095 | 22.2188095 | 2,103 | 20 |
| 20.6433633 | 20.6433633 | 2,232 | 20 |
| 18.9712779 | 18.9712779 | 2,820 | 20 |
| 16.8586968 | 16.8586968 | 2,190 | 21 |
| 15.2180753 | 15.2180753 | 1,873 | 21 |
| 13.8141828 | 13.8141828 | 1,702 | 21 |
| 12.5391427 | 12.5391427 | 1,703 | 22 |
| 11.2633535 | 11.2633535 | 2,322 | 22 |
| 9.5238452 | 9.5238452 | 1,557 | 22 |
| 8.3574307 | 8.3574307 | 1,273 | 23 |
| 7.4037727 | 7.4037727 | 1,142 | 23 |
| 6.5482523 | 6.5482523 | 1,085 | 23 |
| 5.7354329 | 5.7354329 | 1,290 | 23 |
| 4.1390108 | 4.7690394 | 1,541 | 24 |
| 3.1441499 | 3.6138621 | 1,307 | 24 |
| 2.1522856 | 2.6347332 | 1,052 | 24 |
| 1.1289573 | 1.8466356 | 1,269 | 24 |
| 0.0000000 | 0.8959741 | 1,209 | 25 |
2026-01-28 · Shift 1
| From | To | Candidates in row | PDF page |
|---|---|---|---|
| 100.0000000 | 100.0000000 | 1 | 4 |
| 99.0175290 | 99.9992454 | 1,336 | 4 |
| 98.0456223 | 98.9911185 | 1,335 | 4 |
| 97.0888072 | 97.9837462 | 1,306 | 4 |
| 96.0980358 | 96.9982569 | 1,349 | 5 |
| 95.0914181 | 95.9803204 | 1,359 | 5 |
| 94.0365069 | 94.9548380 | 1,422 | 5 |
| 93.0434717 | 93.8818167 | 1,351 | 5 |
| 92.0383632 | 92.8623711 | 1,369 | 6 |
| 91.1917177 | 91.8293428 | 1,158 | 6 |
| 90.0115452 | 90.9555322 | 1,565 | 6 |
| 89.2712963 | 89.7746052 | 1,062 | 6 |
| 88.1054609 | 88.9732348 | 1,555 | 7 |
| 87.1486459 | 87.7998536 | 1,263 | 7 |
| 86.1714570 | 86.8468115 | 1,398 | 7 |
| 85.0252409 | 85.7919003 | 1,516 | 7 |
| 84.2736732 | 84.6479479 | 1,108 | 8 |
| 83.3757159 | 83.8118666 | 1,166 | 8 |
| 82.0566996 | 82.9320193 | 1,928 | 8 |
| 81.4771775 | 81.4771775 | 648 | 8 |
| 80.4773511 | 80.9882058 | 1,380 | 9 |
| 79.4231945 | 79.9468771 | 1,606 | 9 |
| 78.1690725 | 78.7350120 | 1,512 | 9 |
| 77.0062555 | 77.5940780 | 1,638 | 9 |
| 76.3580661 | 76.3580661 | 1,180 | 10 |
| 75.4676547 | 75.4676547 | 996 | 10 |
| 74.7160870 | 74.7160870 | 995 | 10 |
| 73.2808645 | 73.9652740 | 1,944 | 10 |
| 72.4983588 | 72.4983588 | 1,367 | 11 |
| 71.4668397 | 71.4668397 | 1,252 | 11 |
| 70.5220981 | 70.5220981 | 1,202 | 11 |
| 69.6150857 | 69.6150857 | 1,237 | 11 |
| 68.6816628 | 68.6816628 | 1,217 | 12 |
| 67.7633316 | 67.7633316 | 1,712 | 12 |
| 66.4714804 | 66.4714804 | 1,383 | 12 |
| 65.4271334 | 65.4271334 | 1,369 | 12 |
| 64.3941052 | 64.3941052 | 1,400 | 12 |
| 63.3376848 | 63.3376848 | 1,418 | 13 |
| 62.2676818 | 62.2676818 | 2,056 | 13 |
| 60.7162530 | 60.7162530 | 1,724 | 13 |
| 59.4153468 | 59.4153468 | 1,619 | 13 |
| 58.1936720 | 58.1936720 | 1,628 | 14 |
| 56.9652060 | 56.9652060 | 1,769 | 14 |
| 55.6295888 | 55.6295888 | 2,342 | 14 |
| 53.8623484 | 53.8623484 | 1,988 | 15 |
| 52.3622315 | 52.3622315 | 1,905 | 15 |
| 50.9247451 | 50.9247451 | 1,910 | 15 |
| 49.4834859 | 49.4834859 | 1,971 | 15 |
| 47.9961969 | 47.9961969 | 2,801 | 16 |
| 45.8826015 | 45.8826015 | 2,179 | 16 |
| 44.2383586 | 44.2383586 | 2,161 | 16 |
| 42.6076983 | 42.6076983 | 2,050 | 17 |
| 41.0607970 | 41.0607970 | 2,216 | 17 |
| 39.3886344 | 39.3886344 | 3,012 | 17 |
| 37.1158214 | 37.1158214 | 2,353 | 17 |
| 35.3402806 | 35.3402806 | 2,202 | 18 |
| 33.6779276 | 33.6779276 | 2,187 | 18 |
| 32.0268934 | 32.0268934 | 2,373 | 18 |
| 30.2362609 | 30.2362609 | 2,972 | 18 |
| 27.9936313 | 27.9936313 | 2,399 | 19 |
| 26.1833795 | 26.1833795 | 2,192 | 19 |
| 24.5285724 | 24.5285724 | 2,069 | 19 |
| 22.9673340 | 22.9673340 | 2,174 | 20 |
| 21.3268640 | 21.3268640 | 2,699 | 20 |
| 19.2902364 | 19.2902364 | 2,160 | 20 |
| 17.6603307 | 17.6603307 | 1,955 | 21 |
| 16.1851150 | 16.1851150 | 1,709 | 21 |
| 14.8955276 | 14.8955276 | 1,835 | 21 |
| 13.5108623 | 13.5108623 | 2,398 | 21 |
| 11.7006105 | 11.7006105 | 1,688 | 22 |
| 10.4268693 | 10.4268693 | 1,382 | 22 |
| 9.3832769 | 9.3832769 | 1,231 | 22 |
| 8.4536269 | 8.4536269 | 1,349 | 23 |
| 7.4356904 | 7.4356904 | 1,441 | 23 |
| 6.3483320 | 6.3483320 | 1,047 | 23 |
| 5.5582804 | 5.5582804 | 845 | 23 |
| 4.3833901 | 4.9206553 | 1,562 | 24 |
| 3.1028576 | 3.7412374 | 1,414 | 24 |
| 2.0192721 | 2.6742528 | 1,335 | 24 |
| 1.1469707 | 1.6668805 | 903 | 24 |
| 0.0000000 | 0.9854893 | 1,314 | 25 |
2026-01-28 · Shift 2
| From | To | Candidates in row | PDF page |
|---|---|---|---|
| 100.0000000 | 100.0000000 | 1 | 4 |
| 99.0090928 | 99.9992442 | 1,355 | 4 |
| 98.0521984 | 98.9750799 | 1,294 | 4 |
| 97.0650703 | 97.9955103 | 1,370 | 4 |
| 96.0968383 | 96.9600085 | 1,283 | 5 |
| 95.0106951 | 95.9902648 | 1,489 | 5 |
| 94.1437458 | 94.8648179 | 1,170 | 5 |
| 93.1278958 | 93.9804842 | 1,367 | 5 |
| 92.1173367 | 92.9472499 | 1,379 | 6 |
| 91.0175884 | 91.9049455 | 1,494 | 6 |
| 90.0289487 | 90.7757194 | 1,322 | 6 |
| 89.2179316 | 89.7764979 | 1,131 | 6 |
| 88.0138772 | 88.9216420 | 1,632 | 7 |
| 87.0464011 | 87.6881099 | 1,316 | 7 |
| 86.3487600 | 86.6934234 | 987 | 7 |
| 85.1598225 | 85.9474086 | 1,536 | 7 |
| 84.4266570 | 84.7856814 | 1,060 | 8 |
| 83.1288784 | 83.9844901 | 1,796 | 8 |
| 82.1901242 | 82.6270001 | 1,341 | 8 |
| 81.0775266 | 81.6134177 | 1,417 | 8 |
| 80.0170820 | 80.5408796 | 1,394 | 9 |
| 79.4872376 | 79.4872376 | 932 | 9 |
| 78.1312593 | 78.7827940 | 1,676 | 9 |
| 77.5160049 | 77.5160049 | 776 | 9 |
| 76.2388461 | 76.9294725 | 1,918 | 10 |
| 75.4797699 | 75.4797699 | 976 | 10 |
| 74.7420693 | 74.7420693 | 1,041 | 10 |
| 73.2258528 | 73.9552391 | 1,964 | 10 |
| 72.4707679 | 72.4707679 | 1,370 | 11 |
| 71.4352660 | 71.4352660 | 1,152 | 11 |
| 70.5645375 | 70.5645375 | 1,123 | 11 |
| 69.7157283 | 69.7157283 | 1,189 | 11 |
| 68.8170336 | 68.8170336 | 1,155 | 12 |
| 67.9440376 | 67.9440376 | 1,661 | 12 |
| 66.6885860 | 66.6885860 | 1,390 | 12 |
| 65.6364557 | 65.6364557 | 1,394 | 12 |
| 64.5828137 | 64.5828137 | 1,339 | 12 |
| 63.5707429 | 63.5707429 | 1,314 | 13 |
| 62.5775682 | 62.5775682 | 1,959 | 13 |
| 61.0968761 | 61.0968761 | 1,677 | 13 |
| 59.8293312 | 59.8293312 | 1,598 | 13 |
| 58.6214976 | 58.6214976 | 1,561 | 14 |
| 57.4416302 | 57.4416302 | 1,551 | 14 |
| 56.2693212 | 56.2693212 | 2,356 | 14 |
| 54.4885604 | 54.4885604 | 1,962 | 14 |
| 53.0048449 | 53.0048449 | 1,818 | 15 |
| 51.6299706 | 51.6299706 | 1,827 | 15 |
| 50.2490495 | 50.2490495 | 1,770 | 15 |
| 48.9112114 | 48.9112114 | 2,832 | 16 |
| 46.7706704 | 46.7706704 | 2,156 | 16 |
| 45.1410777 | 45.1410777 | 1,938 | 16 |
| 43.6762583 | 43.6762583 | 1,959 | 16 |
| 42.1955662 | 42.1955662 | 1,859 | 17 |
| 40.7904583 | 40.7904583 | 3,019 | 17 |
| 38.5078192 | 38.5078192 | 2,288 | 17 |
| 36.7776997 | 36.7776997 | 2,108 | 17 |
| 35.1843874 | 35.1843874 | 2,088 | 18 |
| 33.6061918 | 33.6061918 | 1,937 | 18 |
| 32.1421283 | 32.1421283 | 3,056 | 18 |
| 29.8315231 | 29.8315231 | 2,251 | 19 |
| 28.1301255 | 28.1301255 | 2,132 | 19 |
| 26.5186730 | 26.5186730 | 1,976 | 19 |
| 25.0251317 | 25.0251317 | 1,789 | 19 |
| 23.6729326 | 23.6729326 | 2,916 | 20 |
| 21.4673893 | 21.4673893 | 2,100 | 20 |
| 19.8793678 | 19.8793678 | 1,883 | 20 |
| 18.4561197 | 18.4561197 | 1,690 | 20 |
| 17.1787488 | 17.1787488 | 1,579 | 21 |
| 15.9852762 | 15.9852762 | 2,471 | 21 |
| 14.1168379 | 14.1168379 | 1,763 | 21 |
| 12.7842906 | 12.7842906 | 1,590 | 22 |
| 11.5825038 | 11.5825038 | 1,400 | 22 |
| 10.5243267 | 10.5243267 | 1,189 | 22 |
| 9.6256321 | 9.6256321 | 2,051 | 22 |
| 8.0754027 | 8.0754027 | 1,176 | 23 |
| 7.1865339 | 7.1865339 | 1,001 | 23 |
| 6.4299373 | 6.4299373 | 939 | 23 |
| 5.1344263 | 5.7202029 | 2,066 | 23 |
| 4.1586359 | 4.1586359 | 667 | 24 |
| 3.2092999 | 3.6544901 | 1,074 | 24 |
| 2.0135598 | 2.8427171 | 1,464 | 24 |
| 1.1496338 | 1.7361662 | 1,174 | 24 |
| 0.0000000 | 0.8488092 | 1,137 | 25 |
2026-04-02 · Shift 1
| From | To | Candidates in row | PDF page |
|---|---|---|---|
| 100.0000000 | 100.0000000 | 1 | 26 |
| 99.0186875 | 99.9991143 | 1,145 | 26 |
| 98.0542025 | 98.9823753 | 1,124 | 26 |
| 97.0356921 | 97.9860066 | 1,182 | 26 |
| 96.1119476 | 96.9356124 | 1,069 | 27 |
| 95.0039855 | 95.9870693 | 1,257 | 27 |
| 94.1386945 | 94.8737933 | 1,039 | 27 |
| 93.1139846 | 93.9527057 | 1,118 | 27 |
| 92.0441059 | 92.9625365 | 1,265 | 28 |
| 91.0247099 | 91.8412895 | 1,174 | 28 |
| 90.1133646 | 90.8006377 | 1,040 | 28 |
| 89.1772208 | 89.8786644 | 1,087 | 28 |
| 88.1241697 | 88.9150651 | 1,146 | 29 |
| 87.0888318 | 87.9000974 | 1,253 | 29 |
| 86.2111416 | 86.7894783 | 979 | 29 |
| 85.0270127 | 85.9224161 | 1,344 | 29 |
| 84.0926402 | 84.7320875 | 1,099 | 30 |
| 83.0714729 | 83.7587459 | 1,170 | 30 |
| 82.3452307 | 82.7225224 | 882 | 30 |
| 81.1761580 | 81.9413692 | 1,354 | 30 |
| 80.3321229 | 80.7421840 | 907 | 31 |
| 79.0824551 | 79.9388894 | 1,488 | 31 |
| 78.1870516 | 78.6201399 | 1,004 | 31 |
| 77.2872199 | 77.7309361 | 1,069 | 31 |
| 76.3377912 | 76.7841644 | 1,038 | 32 |
| 75.3511646 | 75.8648481 | 1,125 | 32 |
| 74.2201754 | 74.8684793 | 1,423 | 32 |
| 73.0360464 | 73.6081835 | 1,259 | 32 |
| 72.4931361 | 72.4931361 | 624 | 33 |
| 71.1690727 | 71.9404836 | 1,643 | 33 |
| 70.4853423 | 70.4853423 | 755 | 33 |
| 69.2029050 | 69.8166681 | 1,366 | 33 |
| 68.6068550 | 68.6068550 | 1,012 | 34 |
| 67.7105659 | 67.7105659 | 822 | 34 |
| 66.2890798 | 66.9825525 | 1,500 | 34 |
| 65.6540608 | 65.6540608 | 779 | 34 |
| 64.9641307 | 64.9641307 | 1,182 | 35 |
| 63.0139049 | 63.9172792 | 1,940 | 35 |
| 62.1990966 | 62.1990966 | 897 | 35 |
| 61.4046586 | 61.4046586 | 878 | 35 |
| 60.6270481 | 60.6270481 | 1,488 | 36 |
| 59.3091843 | 59.3091843 | 1,054 | 36 |
| 58.3756975 | 58.3756975 | 1,078 | 36 |
| 57.4209547 | 57.4209547 | 1,057 | 36 |
| 56.4848109 | 56.4848109 | 1,041 | 36 |
| 55.5628377 | 55.5628377 | 1,799 | 37 |
| 53.9695333 | 53.9695333 | 1,227 | 37 |
| 52.8828270 | 52.8828270 | 1,165 | 37 |
| 51.3943916 | 51.8510318 | 1,210 | 37 |
| 50.7802675 | 50.7802675 | 1,127 | 38 |
| 49.7821274 | 49.7821274 | 2,016 | 38 |
| 47.9966345 | 47.9966345 | 1,346 | 38 |
| 46.8045346 | 46.8045346 | 1,306 | 38 |
| 45.6478611 | 45.6478611 | 1,293 | 38 |
| 44.5027013 | 44.5027013 | 1,328 | 39 |
| 43.3265433 | 43.3265433 | 2,292 | 39 |
| 41.2966079 | 41.2966079 | 1,589 | 39 |
| 39.8892924 | 39.8892924 | 1,499 | 40 |
| 38.5616863 | 38.5616863 | 1,377 | 40 |
| 37.3421309 | 37.3421309 | 1,327 | 40 |
| 36.1668586 | 36.1668586 | 2,359 | 40 |
| 34.0775839 | 34.0775839 | 1,632 | 41 |
| 32.6321849 | 32.6321849 | 1,506 | 41 |
| 31.2983792 | 31.2983792 | 1,506 | 41 |
| 29.9645736 | 29.9645736 | 1,437 | 42 |
| 28.6918785 | 28.6918785 | 2,357 | 42 |
| 26.6043752 | 26.6043752 | 1,527 | 42 |
| 25.2519706 | 25.2519706 | 1,502 | 42 |
| 23.9217076 | 23.9217076 | 1,476 | 43 |
| 22.6144717 | 22.6144717 | 1,298 | 43 |
| 21.4648835 | 21.4648835 | 2,334 | 43 |
| 19.3968648 | 19.3968648 | 1,511 | 44 |
| 18.0586308 | 18.0586308 | 1,274 | 44 |
| 16.9302985 | 16.9302985 | 1,173 | 44 |
| 15.8914179 | 15.8914179 | 1,101 | 44 |
| 14.9163050 | 14.9163050 | 1,991 | 45 |
| 13.1529537 | 13.1529537 | 1,192 | 45 |
| 12.0972456 | 12.0972456 | 1,065 | 45 |
| 11.1540165 | 11.1540165 | 995 | 45 |
| 10.2727836 | 10.2727836 | 861 | 45 |
| 9.5093437 | 9.5093437 | 1,668 | 46 |
| 8.0311753 | 8.0311753 | 926 | 46 |
| 7.2110531 | 7.2110531 | 756 | 46 |
| 6.5414932 | 6.5414932 | 686 | 46 |
| 5.3901337 | 5.9339297 | 1,729 | 47 |
| 4.4026216 | 4.4026216 | 525 | 47 |
| 3.2415198 | 3.9376495 | 1,092 | 47 |
| 2.1043309 | 2.9705075 | 1,259 | 47 |
| 1.0043397 | 1.8554601 | 1,090 | 48 |
| 0.0008857 | 0.8900895 | 1,004 | 48 |
2026-04-02 · Shift 2
| From | To | Candidates in row | PDF page |
|---|---|---|---|
| 100.0000000 | 100.0000000 | 3 | 26 |
| 99.0293996 | 99.9973601 | 1,124 | 26 |
| 98.0561593 | 98.9986009 | 1,140 | 26 |
| 97.0820391 | 97.9928019 | 1,154 | 26 |
| 96.0727202 | 96.9755634 | 1,147 | 27 |
| 95.0968400 | 95.9653646 | 1,104 | 27 |
| 94.0162441 | 94.9912444 | 1,304 | 27 |
| 93.0438838 | 93.8420112 | 1,068 | 27 |
| 92.0213655 | 92.9013296 | 1,234 | 28 |
| 91.0472453 | 91.8145740 | 1,120 | 28 |
| 90.1989599 | 90.8281342 | 971 | 28 |
| 89.2090003 | 89.9736891 | 1,140 | 28 |
| 88.1504035 | 88.9705300 | 1,262 | 29 |
| 87.3047580 | 87.8600153 | 1,012 | 29 |
| 86.0050510 | 86.9694916 | 1,481 | 29 |
| 85.2509218 | 85.6662648 | 900 | 29 |
| 84.1254477 | 84.8734172 | 1,282 | 30 |
| 83.2208446 | 83.7453032 | 1,086 | 30 |
| 82.3479202 | 82.7896622 | 1,024 | 30 |
| 81.4459570 | 81.8885789 | 1,097 | 30 |
| 80.3715208 | 80.9232583 | 1,201 | 31 |
| 79.3314033 | 79.8664215 | 1,213 | 31 |
| 78.0906539 | 78.7990250 | 1,499 | 31 |
| 77.4799588 | 77.4799588 | 713 | 31 |
| 76.2207302 | 76.8525444 | 1,421 | 32 |
| 75.6021154 | 75.6021154 | 1,010 | 32 |
| 74.7133517 | 74.7133517 | 895 | 32 |
| 73.1962936 | 73.9257838 | 1,671 | 32 |
| 72.4553638 | 72.4553638 | 802 | 33 |
| 71.7496326 | 71.7496326 | 1,220 | 33 |
| 70.6760764 | 70.6760764 | 1,008 | 33 |
| 69.7890726 | 69.7890726 | 1,006 | 33 |
| 68.0493836 | 68.9038287 | 1,920 | 34 |
| 67.2142977 | 67.2142977 | 1,426 | 34 |
| 65.9594689 | 65.9594689 | 1,217 | 34 |
| 64.8885525 | 64.8885525 | 1,186 | 35 |
| 63.8449151 | 63.8449151 | 1,178 | 35 |
| 62.8074375 | 62.8074375 | 1,089 | 35 |
| 61.8491566 | 61.8491566 | 1,731 | 35 |
| 60.3259387 | 60.3259387 | 1,452 | 36 |
| 59.0482308 | 59.0482308 | 1,310 | 36 |
| 57.8954779 | 57.8954779 | 1,277 | 36 |
| 56.7717637 | 56.7717637 | 1,296 | 36 |
| 55.6313302 | 55.6313302 | 1,969 | 37 |
| 53.8986809 | 53.8986809 | 1,624 | 37 |
| 52.4687393 | 52.4687393 | 1,490 | 37 |
| 51.1575928 | 51.1575928 | 1,450 | 37 |
| 49.8816448 | 49.8816448 | 1,408 | 38 |
| 48.6426554 | 48.6426554 | 2,259 | 38 |
| 46.6548165 | 46.6548165 | 1,758 | 38 |
| 45.1078396 | 45.1078396 | 1,651 | 38 |
| 43.6550189 | 43.6550189 | 1,565 | 39 |
| 42.2778751 | 42.2778751 | 1,517 | 39 |
| 40.9429695 | 40.9429695 | 2,426 | 39 |
| 38.8081766 | 38.8081766 | 1,926 | 40 |
| 37.1133658 | 37.1133658 | 1,784 | 40 |
| 35.5435098 | 35.5435098 | 1,650 | 40 |
| 34.0915691 | 34.0915691 | 1,583 | 41 |
| 32.6985859 | 32.6985859 | 2,469 | 41 |
| 30.5259545 | 30.5259545 | 1,809 | 41 |
| 28.9340995 | 28.9340995 | 1,789 | 42 |
| 27.3598437 | 27.3598437 | 1,626 | 42 |
| 25.9290221 | 25.9290221 | 1,543 | 42 |
| 24.5712375 | 24.5712375 | 2,444 | 43 |
| 22.4206052 | 22.6249893 | 1,713 | 43 |
| 20.9141067 | 20.9141067 | 1,514 | 43 |
| 19.5818411 | 19.5818411 | 1,392 | 44 |
| 18.3569310 | 18.3569310 | 1,282 | 44 |
| 17.2288171 | 17.2288171 | 2,028 | 44 |
| 15.4442499 | 15.4442499 | 1,515 | 44 |
| 14.1111043 | 14.1111043 | 1,305 | 45 |
| 12.9627511 | 12.9627511 | 1,191 | 45 |
| 11.0039510 | 11.9138339 | 2,849 | 45 |
| 9.4068162 | 9.4068162 | 1,088 | 46 |
| 8.4494153 | 8.4494153 | 901 | 46 |
| 7.6565676 | 7.6565676 | 810 | 46 |
| 6.3031828 | 6.9437967 | 1,993 | 46 |
| 5.1900282 | 5.1900282 | 659 | 47 |
| 4.1243917 | 4.6101319 | 1,023 | 47 |
| 3.3526632 | 3.7099286 | 1,203 | 47 |
| 2.0423967 | 2.6504519 | 946 | 47 |
| 1.0761961 | 1.8180058 | 969 | 48 |
| 0.0008800 | 0.9653206 | 1,097 | 48 |
2026-04-04 · Shift 1
| From | To | Candidates in row | PDF page |
|---|---|---|---|
| 100.0000000 | 100.0000000 | 2 | 26 |
| 99.0133787 | 99.9982569 | 1,167 | 26 |
| 98.0450604 | 98.9785157 | 1,152 | 26 |
| 97.0549527 | 97.9727197 | 1,175 | 26 |
| 96.0657167 | 96.9468776 | 1,122 | 27 |
| 95.0634070 | 95.9681004 | 1,202 | 27 |
| 94.1099054 | 94.9204689 | 1,112 | 27 |
| 93.0692465 | 93.9512790 | 1,222 | 27 |
| 92.1349196 | 92.8862161 | 1,086 | 28 |
| 91.1090774 | 91.9396871 | 1,174 | 28 |
| 90.2043840 | 90.9164597 | 1,065 | 28 |
| 89.0173007 | 89.9882338 | 1,395 | 28 |
| 88.0176058 | 88.7723885 | 1,179 | 29 |
| 87.2253454 | 87.7448032 | 921 | 29 |
| 86.0896849 | 86.9420839 | 1,319 | 29 |
| 85.2137534 | 85.7916067 | 1,000 | 29 |
| 84.2741971 | 84.9200331 | 1,127 | 30 |
| 83.2631717 | 83.9377696 | 1,140 | 30 |
| 82.2233843 | 82.9441757 | 1,250 | 30 |
| 81.1173574 | 81.8547087 | 1,286 | 30 |
| 80.3207391 | 80.7338650 | 955 | 31 |
| 79.0909487 | 79.9015122 | 1,480 | 31 |
| 78.1862553 | 78.6115832 | 1,004 | 31 |
| 77.2623872 | 77.7365233 | 1,026 | 31 |
| 76.3437486 | 76.8422888 | 1,169 | 32 |
| 75.3048329 | 75.8234192 | 1,141 | 32 |
| 74.3234410 | 74.8289537 | 1,248 | 32 |
| 73.1354861 | 73.7412298 | 1,369 | 32 |
| 72.0041836 | 72.5480455 | 1,241 | 33 |
| 71.4664226 | 71.4664226 | 772 | 33 |
| 70.1285571 | 70.7935678 | 1,536 | 33 |
| 69.4548307 | 69.4548307 | 715 | 33 |
| 68.1832048 | 68.8316556 | 1,706 | 34 |
| 67.3447509 | 67.3447509 | 921 | 34 |
| 66.5420316 | 66.5420316 | 855 | 34 |
| 65.0359524 | 65.7968362 | 1,708 | 34 |
| 64.3081884 | 64.3081884 | 1,158 | 35 |
| 63.2989062 | 63.2989062 | 994 | 35 |
| 62.4325620 | 62.4325620 | 981 | 35 |
| 61.5775483 | 61.5775483 | 976 | 35 |
| 60.7268924 | 60.7268924 | 902 | 36 |
| 59.9407330 | 59.9407330 | 1,380 | 36 |
| 58.7379614 | 58.7379614 | 1,178 | 36 |
| 57.7112477 | 57.7112477 | 1,121 | 36 |
| 56.7342136 | 56.7342136 | 1,129 | 36 |
| 55.7502070 | 55.7502070 | 1,049 | 37 |
| 54.8359263 | 54.8359263 | 1,601 | 37 |
| 53.4405369 | 53.4405369 | 1,438 | 37 |
| 52.1872140 | 52.1872140 | 1,261 | 37 |
| 51.0881597 | 51.0881597 | 1,209 | 37 |
| 50.0344272 | 50.0344272 | 1,194 | 38 |
| 48.9937682 | 48.9937682 | 1,880 | 38 |
| 47.3552098 | 47.3552098 | 1,570 | 38 |
| 45.9868392 | 45.9868392 | 1,406 | 38 |
| 44.7614067 | 44.7614067 | 1,362 | 39 |
| 43.5743234 | 43.5743234 | 1,346 | 39 |
| 42.4003138 | 42.4003138 | 2,079 | 39 |
| 40.5883122 | 40.5883122 | 1,731 | 39 |
| 39.0796183 | 39.0796183 | 1,528 | 40 |
| 37.7478537 | 37.7478537 | 1,480 | 40 |
| 36.4579248 | 36.4579248 | 1,460 | 40 |
| 35.1854273 | 35.1854273 | 2,300 | 40 |
| 33.1808079 | 33.1808079 | 1,765 | 41 |
| 31.6424805 | 31.6424805 | 1,572 | 41 |
| 30.2723668 | 30.2723668 | 1,488 | 41 |
| 28.9754652 | 28.9754652 | 1,397 | 42 |
| 27.7578768 | 27.7578768 | 2,265 | 42 |
| 25.7837626 | 25.7837626 | 1,798 | 42 |
| 24.2166732 | 24.2166732 | 1,435 | 43 |
| 22.9659650 | 22.9659650 | 1,452 | 43 |
| 21.7004401 | 21.7004401 | 1,264 | 43 |
| 20.5987711 | 20.5987711 | 2,133 | 43 |
| 18.7397045 | 18.7397045 | 1,572 | 44 |
| 17.3695908 | 17.3695908 | 1,339 | 44 |
| 16.2025537 | 16.2025537 | 1,201 | 44 |
| 15.1557938 | 15.1557938 | 1,164 | 44 |
| 14.1412821 | 14.1412821 | 1,892 | 45 |
| 12.4922648 | 12.4922648 | 1,269 | 45 |
| 11.3862379 | 11.3862379 | 1,041 | 45 |
| 10.4789297 | 10.4789297 | 946 | 45 |
| 9.6544211 | 9.6544211 | 877 | 46 |
| 8.8891794 | 8.8891794 | 1,470 | 46 |
| 7.6079662 | 7.6079662 | 1,030 | 46 |
| 6.0731250 | 6.7102453 | 1,344 | 46 |
| 5.0472829 | 5.5388504 | 1,566 | 47 |
| 4.1739661 | 4.1739661 | 593 | 47 |
| 3.2867041 | 3.6571229 | 788 | 47 |
| 2.1571447 | 2.9703229 | 1,252 | 47 |
| 1.0214843 | 1.8791127 | 1,129 | 48 |
| 0.0008716 | 0.8951061 | 1,027 | 48 |
2026-04-04 · Shift 2
| From | To | Candidates in row | PDF page |
|---|---|---|---|
| 100.0000000 | 100.0000000 | 1 | 26 |
| 99.0198457 | 99.9991334 | 1,161 | 26 |
| 98.0136927 | 98.9886472 | 1,189 | 26 |
| 97.0352717 | 97.9573620 | 1,159 | 26 |
| 96.0897825 | 96.9520756 | 1,122 | 27 |
| 95.0255655 | 95.9779877 | 1,254 | 27 |
| 94.0306786 | 94.8912384 | 1,179 | 27 |
| 93.0643903 | 93.8694861 | 1,131 | 27 |
| 92.1353670 | 92.8893318 | 1,115 | 28 |
| 91.1595459 | 91.9230436 | 1,104 | 28 |
| 90.1031285 | 90.9662882 | 1,235 | 28 |
| 89.1680388 | 89.8960049 | 1,094 | 28 |
| 88.1523529 | 88.9479158 | 1,210 | 29 |
| 87.1089349 | 87.8992980 | 1,286 | 29 |
| 86.1729786 | 86.7848167 | 1,047 | 29 |
| 85.2378889 | 85.8774591 | 1,134 | 29 |
| 84.2395355 | 84.8947049 | 1,115 | 30 |
| 83.2229829 | 83.9284167 | 1,181 | 30 |
| 82.1778317 | 82.9049311 | 1,256 | 30 |
| 81.0486177 | 81.8164486 | 1,333 | 30 |
| 80.2781870 | 80.6612358 | 952 | 31 |
| 79.3959615 | 79.8362076 | 1,021 | 31 |
| 78.0726233 | 78.9513823 | 1,673 | 31 |
| 77.5015166 | 77.5015166 | 589 | 31 |
| 76.4918970 | 76.9910737 | 1,156 | 32 |
| 75.4892105 | 75.9892538 | 1,285 | 32 |
| 74.2672675 | 74.8756391 | 1,365 | 32 |
| 73.1345871 | 73.6926943 | 1,301 | 32 |
| 72.5652136 | 72.5652136 | 886 | 33 |
| 71.1300806 | 71.7973828 | 1,492 | 33 |
| 70.5043765 | 70.5043765 | 671 | 33 |
| 69.2512349 | 69.9228703 | 1,810 | 33 |
| 68.3542768 | 68.3542768 | 856 | 34 |
| 67.6124448 | 67.6124448 | 852 | 34 |
| 66.1487131 | 66.8732126 | 1,689 | 34 |
| 65.4094809 | 65.4094809 | 1,344 | 34 |
| 64.2447352 | 64.2447352 | 990 | 35 |
| 63.3867753 | 63.3867753 | 992 | 35 |
| 62.5270821 | 62.5270821 | 950 | 35 |
| 61.7037872 | 61.7037872 | 1,010 | 35 |
| 60.8284947 | 60.8284947 | 1,514 | 36 |
| 59.5164226 | 59.5164226 | 1,231 | 36 |
| 58.4496057 | 58.4496057 | 1,204 | 36 |
| 57.4061877 | 57.4061877 | 1,127 | 36 |
| 56.4295000 | 56.4295000 | 1,043 | 36 |
| 55.5256088 | 55.5256088 | 1,842 | 37 |
| 53.9292833 | 53.9292833 | 1,410 | 37 |
| 52.7073403 | 52.7073403 | 1,350 | 37 |
| 51.5373949 | 51.5373949 | 1,201 | 37 |
| 50.4965768 | 50.4965768 | 1,181 | 38 |
| 49.4730913 | 49.4730913 | 2,123 | 38 |
| 47.6323772 | 47.6323772 | 1,485 | 38 |
| 46.3445706 | 46.3445706 | 1,446 | 38 |
| 45.0914291 | 45.0914291 | 1,391 | 38 |
| 43.8859520 | 43.8859520 | 1,325 | 39 |
| 42.7376722 | 42.7376722 | 2,230 | 39 |
| 40.8050958 | 40.8050958 | 1,611 | 39 |
| 39.4089609 | 39.4089609 | 1,527 | 40 |
| 38.0856227 | 38.0856227 | 1,454 | 40 |
| 36.8255481 | 36.8255481 | 1,430 | 40 |
| 35.5862726 | 35.5862726 | 2,365 | 40 |
| 33.5367016 | 33.5367016 | 1,705 | 41 |
| 32.0591039 | 32.0591039 | 1,487 | 41 |
| 30.7704307 | 30.7704307 | 1,530 | 41 |
| 29.4444926 | 29.4444926 | 1,395 | 42 |
| 28.2355490 | 28.2355490 | 2,451 | 42 |
| 26.1114481 | 26.1114481 | 1,677 | 42 |
| 24.6581160 | 24.6581160 | 1,462 | 43 |
| 23.3911084 | 23.3911084 | 1,404 | 43 |
| 22.1743652 | 22.1743652 | 1,338 | 43 |
| 21.0148193 | 21.0148193 | 2,296 | 43 |
| 19.0250455 | 19.0250455 | 1,541 | 44 |
| 17.6895745 | 17.6895745 | 1,321 | 44 |
| 16.5447612 | 16.5447612 | 1,210 | 44 |
| 15.4961435 | 15.4961435 | 1,073 | 44 |
| 14.5662536 | 14.5662536 | 1,944 | 45 |
| 12.8815322 | 12.8815322 | 1,221 | 45 |
| 11.8233816 | 11.8233816 | 1,027 | 45 |
| 10.0961955 | 10.9333564 | 1,812 | 45 |
| 9.3630297 | 9.3630297 | 1,469 | 46 |
| 8.0899558 | 8.0899558 | 935 | 46 |
| 7.2796603 | 7.2796603 | 790 | 46 |
| 6.5950256 | 6.5950256 | 691 | 46 |
| 5.4710114 | 5.9961868 | 1,783 | 47 |
| 4.4509923 | 4.4509923 | 558 | 47 |
| 3.1753185 | 3.9674149 | 1,279 | 47 |
| 2.2480284 | 2.8589999 | 1,014 | 47 |
| 1.0841494 | 1.9802409 | 1,205 | 48 |
| 0.0025999 | 0.9359563 | 1,080 | 48 |
2026-04-05 · Shift 1
| From | To | Candidates in row | PDF page |
|---|---|---|---|
| 100.0000000 | 100.0000000 | 4 | 26 |
| 99.0025502 | 99.9965185 | 1,177 | 26 |
| 98.0190264 | 98.9694759 | 1,158 | 26 |
| 97.0772806 | 97.9615816 | 1,109 | 26 |
| 96.0397935 | 96.9963357 | 1,217 | 27 |
| 95.0345104 | 95.9370893 | 1,178 | 27 |
| 94.0370606 | 94.9117875 | 1,156 | 27 |
| 93.1666855 | 93.9056339 | 1,060 | 27 |
| 92.0491240 | 92.9830364 | 1,264 | 28 |
| 91.1804897 | 91.8828823 | 1,033 | 28 |
| 90.1891325 | 90.9837849 | 1,154 | 28 |
| 89.0680894 | 89.9793721 | 1,304 | 28 |
| 88.1106769 | 88.8444031 | 1,138 | 29 |
| 87.1210605 | 87.8539163 | 1,183 | 29 |
| 86.2411113 | 86.8242626 | 976 | 29 |
| 85.1592351 | 85.9747765 | 1,294 | 29 |
| 84.1957299 | 84.8485112 | 1,147 | 30 |
| 83.2130765 | 83.8501910 | 1,142 | 30 |
| 82.1050891 | 82.8562227 | 1,335 | 30 |
| 81.3417702 | 81.6942721 | 858 | 30 |
| 80.1067080 | 80.9474903 | 1,459 | 31 |
| 79.2241477 | 79.6776131 | 1,057 | 31 |
| 78.3224391 | 78.7576267 | 1,126 | 31 |
| 77.2649335 | 77.7775844 | 1,164 | 31 |
| 76.2152612 | 76.7644678 | 1,263 | 32 |
| 75.0176251 | 75.6651841 | 1,381 | 32 |
| 74.4631962 | 74.4631962 | 688 | 32 |
| 73.2411896 | 73.8643782 | 1,382 | 32 |
| 72.6615198 | 72.6615198 | 908 | 33 |
| 71.1087708 | 71.8712193 | 1,727 | 33 |
| 70.3680816 | 70.3680816 | 786 | 33 |
| 69.0146484 | 69.6839668 | 1,910 | 33 |
| 68.0215505 | 68.0215505 | 1,005 | 34 |
| 67.1468236 | 67.1468236 | 966 | 34 |
| 66.3060413 | 66.3060413 | 923 | 34 |
| 65.5026851 | 65.5026851 | 940 | 34 |
| 64.6845326 | 64.6845326 | 1,351 | 35 |
| 63.5086559 | 63.5086559 | 1,172 | 35 |
| 62.4885763 | 62.4885763 | 1,138 | 35 |
| 61.4980895 | 61.4980895 | 1,124 | 35 |
| 60.5197880 | 60.5197880 | 1,072 | 36 |
| 59.5867459 | 59.5867459 | 1,705 | 36 |
| 58.1027565 | 58.1027565 | 1,427 | 36 |
| 56.8607313 | 56.8607313 | 1,316 | 36 |
| 55.7153177 | 55.7153177 | 1,280 | 37 |
| 54.6012377 | 54.6012377 | 1,226 | 37 |
| 53.5341579 | 53.5341579 | 1,903 | 37 |
| 51.8778342 | 51.8778342 | 1,535 | 37 |
| 50.5418085 | 50.5418085 | 1,507 | 38 |
| 49.2301533 | 49.2301533 | 1,394 | 38 |
| 48.0168505 | 48.0168505 | 1,431 | 38 |
| 46.7713438 | 46.7713438 | 2,167 | 38 |
| 44.8852411 | 44.8852411 | 1,753 | 39 |
| 43.3594736 | 43.3594736 | 1,562 | 39 |
| 41.9999478 | 41.9999478 | 1,630 | 39 |
| 40.5812365 | 40.5812365 | 1,499 | 39 |
| 39.2765443 | 39.2765443 | 2,387 | 40 |
| 37.1989590 | 37.1989590 | 1,703 | 40 |
| 35.7167103 | 35.7167103 | 1,592 | 40 |
| 34.3310733 | 34.3310733 | 1,548 | 41 |
| 32.9837327 | 32.9837327 | 1,480 | 41 |
| 31.6955776 | 31.6955776 | 2,441 | 41 |
| 29.5709921 | 29.5709921 | 1,674 | 42 |
| 28.1139843 | 28.1139843 | 1,623 | 42 |
| 26.7004952 | 26.7004952 | 1,569 | 42 |
| 25.3348768 | 25.3348768 | 1,402 | 42 |
| 24.1146110 | 24.1146110 | 2,321 | 43 |
| 22.0944705 | 22.0944705 | 1,663 | 43 |
| 20.6470368 | 20.6470368 | 1,365 | 43 |
| 19.4589749 | 19.4589749 | 1,334 | 44 |
| 18.2978946 | 18.2978946 | 1,208 | 44 |
| 17.2464815 | 17.2464815 | 2,069 | 44 |
| 15.4456755 | 15.4456755 | 1,386 | 44 |
| 14.2393357 | 14.2393357 | 1,272 | 45 |
| 13.1322187 | 13.1322187 | 1,107 | 45 |
| 12.1687135 | 12.1687135 | 981 | 45 |
| 11.3148756 | 11.3148756 | 1,703 | 45 |
| 9.8326269 | 9.8326269 | 1,030 | 46 |
| 8.1014509 | 8.9352702 | 1,780 | 46 |
| 7.3860026 | 7.3860026 | 753 | 46 |
| 6.7306102 | 6.7306102 | 1,340 | 46 |
| 5.5643077 | 5.5643077 | 718 | 47 |
| 4.4354312 | 4.9393784 | 1,095 | 47 |
| 3.6294639 | 3.9863177 | 1,227 | 47 |
| 2.2403454 | 2.9183675 | 1,067 | 47 |
| 1.0313944 | 1.9888070 | 1,249 | 48 |
| 0.0008704 | 0.9017085 | 1,036 | 48 |
2026-04-05 · Shift 2
| From | To | Candidates in row | PDF page |
|---|---|---|---|
| 100.0000000 | 100.0000000 | 1 | 26 |
| 99.0287224 | 99.9991336 | 1,156 | 26 |
| 98.0167223 | 98.9940649 | 1,195 | 26 |
| 97.0159858 | 97.9578044 | 1,183 | 26 |
| 96.0854308 | 96.9319413 | 1,110 | 27 |
| 95.0318416 | 95.9675952 | 1,248 | 27 |
| 94.0761599 | 94.8862799 | 1,106 | 27 |
| 93.1326084 | 93.9279990 | 1,131 | 27 |
| 92.1275397 | 92.9480570 | 1,167 | 28 |
| 91.1562622 | 91.9369233 | 1,146 | 28 |
| 90.1234675 | 90.9439848 | 1,211 | 28 |
| 89.1955118 | 89.8947277 | 1,097 | 28 |
| 88.1479877 | 88.9442447 | 1,225 | 29 |
| 87.0536759 | 87.8828575 | 1,356 | 29 |
| 86.0546723 | 86.7079669 | 1,098 | 29 |
| 85.0885933 | 85.7566174 | 1,139 | 29 |
| 84.0800589 | 84.7697440 | 1,201 | 30 |
| 83.0230039 | 83.7291513 | 1,304 | 30 |
| 82.2007538 | 82.5993155 | 947 | 30 |
| 81.3611749 | 81.7787982 | 960 | 30 |
| 80.4011610 | 80.9461508 | 1,174 | 31 |
| 79.4550102 | 79.9289520 | 1,119 | 31 |
| 78.5192566 | 78.9585409 | 1,176 | 31 |
| 77.3902872 | 77.9396092 | 1,238 | 31 |
| 76.3237014 | 76.8669584 | 1,242 | 32 |
| 75.0604341 | 75.7908417 | 1,561 | 32 |
| 74.4383312 | 74.4383312 | 742 | 32 |
| 73.2114543 | 73.7954339 | 1,355 | 32 |
| 72.6214097 | 72.6214097 | 916 | 33 |
| 71.0661526 | 71.8277520 | 1,664 | 33 |
| 70.3859984 | 70.3859984 | 754 | 33 |
| 69.0854742 | 69.7327037 | 1,856 | 33 |
| 68.1245939 | 68.1245939 | 936 | 34 |
| 67.3136074 | 67.3136074 | 901 | 34 |
| 66.5329463 | 66.5329463 | 930 | 34 |
| 65.7271585 | 65.7271585 | 875 | 34 |
| 64.9690248 | 64.9690248 | 1,248 | 35 |
| 63.8877096 | 63.8877096 | 1,133 | 35 |
| 62.9060347 | 62.9060347 | 1,061 | 35 |
| 61.1177057 | 61.9867435 | 2,006 | 35 |
| 60.2486679 | 60.2486679 | 1,594 | 36 |
| 58.8675649 | 58.8675649 | 1,187 | 36 |
| 57.8391024 | 57.8391024 | 1,133 | 36 |
| 56.8574275 | 56.8574275 | 1,161 | 36 |
| 55.8514924 | 55.8514924 | 1,082 | 37 |
| 54.9140060 | 54.9140060 | 1,801 | 37 |
| 53.3535502 | 53.3535502 | 1,345 | 37 |
| 52.1881904 | 52.1881904 | 1,348 | 37 |
| 51.0202313 | 51.0202313 | 1,257 | 37 |
| 49.9311181 | 49.9311181 | 1,173 | 38 |
| 48.9147858 | 48.9147858 | 1,994 | 38 |
| 47.1871074 | 47.1871074 | 1,523 | 38 |
| 45.8675216 | 45.8675216 | 1,377 | 38 |
| 44.6744357 | 44.6744357 | 1,366 | 39 |
| 43.4908807 | 43.4908807 | 1,342 | 39 |
| 42.3281203 | 42.3281203 | 2,189 | 39 |
| 40.4314864 | 40.4314864 | 1,517 | 39 |
| 39.1170992 | 39.1170992 | 1,458 | 40 |
| 37.8538318 | 37.8538318 | 1,433 | 40 |
| 36.6122254 | 36.6122254 | 1,353 | 40 |
| 35.4399342 | 35.4399342 | 2,303 | 40 |
| 33.4445263 | 33.4445263 | 1,632 | 41 |
| 32.0304986 | 32.0304986 | 1,504 | 41 |
| 30.7273751 | 30.7273751 | 1,378 | 41 |
| 29.5334229 | 29.5334229 | 1,331 | 42 |
| 28.3801932 | 28.3801932 | 2,343 | 42 |
| 26.3492614 | 26.3492614 | 1,562 | 42 |
| 24.9958844 | 24.9958844 | 1,381 | 43 |
| 23.7993328 | 23.7993328 | 1,324 | 43 |
| 22.6521683 | 22.6521683 | 1,233 | 43 |
| 21.5838496 | 21.5838496 | 2,226 | 43 |
| 19.6551575 | 19.6551575 | 1,455 | 44 |
| 18.3944895 | 18.3944895 | 1,279 | 44 |
| 17.2863146 | 17.2863146 | 1,205 | 44 |
| 16.2422562 | 16.2422562 | 1,041 | 44 |
| 15.3402937 | 15.3402937 | 1,893 | 44 |
| 13.7001256 | 13.7001256 | 1,232 | 45 |
| 12.6326734 | 12.6326734 | 1,046 | 45 |
| 11.7263787 | 11.7263787 | 964 | 45 |
| 10.1468613 | 10.8911320 | 2,444 | 45 |
| 8.7735563 | 8.7735563 | 986 | 46 |
| 7.2408266 | 7.9192479 | 1,477 | 46 |
| 6.1040593 | 6.6395183 | 1,845 | 46 |
| 5.0409392 | 5.0409392 | 591 | 47 |
| 4.1103843 | 4.5288741 | 924 | 47 |
| 3.3903739 | 3.7282849 | 1,130 | 47 |
| 2.1972880 | 2.7492094 | 892 | 47 |
| 1.0925790 | 1.9763462 | 1,168 | 48 |
| 0.0017329 | 0.9643461 | 1,113 | 48 |
2026-04-06 · Shift 1
| From | To | Candidates in row | PDF page |
|---|---|---|---|
| 100.0000000 | 100.0000000 | 2 | 26 |
| 99.0046554 | 99.9982629 | 1,168 | 26 |
| 98.0371039 | 98.9785992 | 1,163 | 26 |
| 97.0157032 | 97.9684894 | 1,199 | 26 |
| 96.0533630 | 96.9271123 | 1,127 | 27 |
| 95.1014452 | 95.9482699 | 1,122 | 27 |
| 94.1243399 | 94.9737702 | 1,152 | 27 |
| 93.1559200 | 93.9732143 | 1,137 | 27 |
| 92.1154113 | 92.9856865 | 1,253 | 28 |
| 91.1261465 | 91.8974083 | 1,129 | 28 |
| 90.0361312 | 90.9168288 | 1,290 | 28 |
| 89.0850820 | 89.7964147 | 1,115 | 28 |
| 88.0419678 | 88.8279947 | 1,255 | 29 |
| 87.1777724 | 87.7379794 | 972 | 29 |
| 86.2406198 | 86.8937604 | 1,164 | 29 |
| 85.2270359 | 85.8827821 | 1,115 | 29 |
| 84.1387576 | 84.9143621 | 1,322 | 30 |
| 83.0348457 | 83.7652863 | 1,404 | 30 |
| 82.1063785 | 82.5458588 | 1,022 | 30 |
| 81.2030989 | 81.6582129 | 1,036 | 30 |
| 80.1512993 | 80.7584074 | 1,334 | 31 |
| 79.0986312 | 79.5997777 | 1,205 | 31 |
| 78.0563855 | 78.5531893 | 1,460 | 31 |
| 77.2851237 | 77.2851237 | 724 | 31 |
| 76.0092412 | 76.6563021 | 1,477 | 32 |
| 75.3734714 | 75.3734714 | 745 | 32 |
| 74.7264105 | 74.7264105 | 1,171 | 32 |
| 73.7093524 | 73.7093524 | 909 | 32 |
| 72.1546693 | 72.9198513 | 1,730 | 33 |
| 71.4172804 | 71.4172804 | 844 | 33 |
| 70.6842343 | 70.6842343 | 1,366 | 33 |
| 69.4978113 | 69.4978113 | 1,043 | 33 |
| 68.5919261 | 68.5919261 | 983 | 34 |
| 67.7381531 | 67.7381531 | 1,088 | 34 |
| 66.7931837 | 66.7931837 | 1,079 | 34 |
| 65.8560311 | 65.8560311 | 1,703 | 34 |
| 64.3769108 | 64.3769108 | 1,361 | 35 |
| 63.1948305 | 63.1948305 | 1,234 | 35 |
| 62.1230545 | 62.1230545 | 1,230 | 35 |
| 61.0547526 | 61.0547526 | 1,172 | 35 |
| 60.0368260 | 60.0368260 | 2,000 | 36 |
| 58.2997499 | 58.2997499 | 1,479 | 36 |
| 57.0151820 | 57.0151820 | 1,443 | 36 |
| 55.7618816 | 55.7618816 | 1,415 | 37 |
| 54.5329002 | 54.5329002 | 1,377 | 37 |
| 53.3369233 | 53.3369233 | 2,475 | 37 |
| 51.1872916 | 51.1872916 | 1,713 | 37 |
| 49.6994858 | 49.6994858 | 1,585 | 38 |
| 48.3228530 | 48.3228530 | 1,668 | 38 |
| 46.8741315 | 46.8741315 | 1,552 | 38 |
| 45.5261604 | 45.5261604 | 2,781 | 38 |
| 43.1107560 | 43.1107560 | 1,897 | 39 |
| 41.4631392 | 41.4631392 | 1,785 | 39 |
| 39.9127988 | 39.9127988 | 1,661 | 40 |
| 38.4701570 | 38.4701570 | 1,577 | 40 |
| 37.1004725 | 37.1004725 | 2,797 | 40 |
| 34.6711715 | 34.6711715 | 1,961 | 41 |
| 32.9670998 | 32.9670998 | 1,787 | 41 |
| 31.4150222 | 31.4150222 | 1,727 | 41 |
| 29.9150570 | 29.9150570 | 1,559 | 42 |
| 28.5610061 | 28.5610061 | 2,792 | 42 |
| 26.1360478 | 26.1360478 | 1,824 | 42 |
| 24.5518344 | 24.5518344 | 1,680 | 43 |
| 23.0926904 | 23.0926904 | 1,573 | 43 |
| 21.7264800 | 21.7264800 | 1,393 | 43 |
| 20.5166064 | 20.5166064 | 2,494 | 43 |
| 18.3504725 | 18.3504725 | 1,544 | 44 |
| 17.0094497 | 17.0094497 | 1,402 | 44 |
| 15.7917593 | 15.7917593 | 1,332 | 44 |
| 14.6348666 | 14.6348666 | 1,194 | 45 |
| 13.5978321 | 13.5978321 | 2,045 | 45 |
| 11.8216718 | 11.8216718 | 1,306 | 45 |
| 10.6873610 | 10.6873610 | 1,144 | 45 |
| 9.6937535 | 9.6937535 | 979 | 46 |
| 8.0791412 | 8.8434547 | 2,455 | 46 |
| 6.0207059 | 6.7111937 | 1,523 | 46 |
| 5.3884102 | 5.3884102 | 602 | 47 |
| 4.4278071 | 4.8655503 | 1,474 | 47 |
| 3.1423708 | 3.5853252 | 911 | 47 |
| 2.2807810 | 2.7940870 | 1,213 | 47 |
| 1.0908838 | 1.7405503 | 1,093 | 48 |
| 0.0060798 | 0.7912382 | 911 | 48 |
2026-04-06 · Shift 2
| From | To | Candidates in row | PDF page |
|---|---|---|---|
| 100.0000000 | 100.0000000 | 1 | 26 |
| 99.0243312 | 99.9991350 | 1,153 | 26 |
| 98.0521222 | 98.9975176 | 1,167 | 26 |
| 97.0306107 | 97.9881155 | 1,180 | 26 |
| 96.0471573 | 96.9674691 | 1,186 | 27 |
| 95.1130063 | 95.9416329 | 1,098 | 27 |
| 94.0421925 | 94.9910477 | 1,255 | 27 |
| 93.0431699 | 93.9055297 | 1,178 | 27 |
| 92.0251183 | 92.8866131 | 1,214 | 28 |
| 91.0537742 | 91.8365582 | 1,120 | 28 |
| 90.0954045 | 90.8678090 | 1,139 | 28 |
| 89.0245907 | 89.8826257 | 1,249 | 28 |
| 88.1224430 | 88.8022973 | 1,074 | 29 |
| 87.1545587 | 87.8733360 | 1,137 | 29 |
| 86.1174781 | 86.8898826 | 1,230 | 29 |
| 85.1911117 | 85.8251235 | 1,034 | 29 |
| 84.1367320 | 84.9307604 | 1,281 | 30 |
| 83.2432339 | 83.8227535 | 1,036 | 30 |
| 82.2744847 | 82.9266605 | 1,110 | 30 |
| 81.3161150 | 81.9665609 | 1,163 | 30 |
| 80.2418413 | 80.9606186 | 1,249 | 31 |
| 79.0819372 | 79.8802903 | 1,372 | 31 |
| 78.3129925 | 78.6935725 | 864 | 31 |
| 77.0925415 | 77.9462517 | 1,473 | 31 |
| 76.2362364 | 76.6721735 | 1,037 | 32 |
| 75.3461981 | 75.7752156 | 1,165 | 32 |
| 74.3238217 | 74.7675434 | 1,096 | 32 |
| 73.3100949 | 73.8195532 | 1,175 | 32 |
| 72.1839240 | 72.8032315 | 1,382 | 33 |
| 71.0343992 | 71.6078642 | 1,315 | 33 |
| 70.4704488 | 70.4704488 | 705 | 33 |
| 69.0181900 | 69.8606558 | 1,736 | 33 |
| 68.3590946 | 68.3590946 | 808 | 34 |
| 67.0071705 | 67.6602112 | 1,521 | 34 |
| 66.3446152 | 66.3446152 | 1,303 | 34 |
| 65.2175793 | 65.2175793 | 928 | 34 |
| 64.4149014 | 64.4149014 | 886 | 35 |
| 63.6485516 | 63.6485516 | 874 | 35 |
| 62.1556399 | 62.8925813 | 2,326 | 35 |
| 60.8806968 | 60.8806968 | 1,072 | 36 |
| 59.0712117 | 59.9526005 | 2,020 | 36 |
| 58.2053921 | 58.2053921 | 1,035 | 36 |
| 57.3101641 | 57.3101641 | 1,855 | 36 |
| 55.7056732 | 55.7056732 | 1,259 | 37 |
| 54.6166954 | 54.6166954 | 1,276 | 37 |
| 53.5130132 | 53.5130132 | 1,248 | 37 |
| 52.4335499 | 52.4335499 | 1,175 | 37 |
| 51.4172282 | 51.4172282 | 2,299 | 37 |
| 49.4286975 | 49.4286975 | 1,454 | 38 |
| 48.1710534 | 48.1710534 | 1,384 | 38 |
| 46.9739562 | 46.9739562 | 1,368 | 38 |
| 45.7906983 | 45.7906983 | 1,347 | 38 |
| 44.6256044 | 44.6256044 | 2,484 | 39 |
| 42.4770571 | 42.4770571 | 1,646 | 39 |
| 41.0533418 | 41.0533418 | 1,558 | 39 |
| 39.7057424 | 39.7057424 | 1,503 | 40 |
| 38.4057156 | 38.4057156 | 1,424 | 40 |
| 37.1740202 | 37.1740202 | 2,652 | 40 |
| 34.8801605 | 34.8801605 | 1,803 | 41 |
| 33.3206473 | 33.3206473 | 1,645 | 41 |
| 31.8977970 | 31.8977970 | 1,599 | 41 |
| 30.5147345 | 30.5147345 | 1,520 | 41 |
| 29.2000035 | 29.2000035 | 2,765 | 42 |
| 26.8084039 | 26.8084039 | 1,742 | 42 |
| 25.3016529 | 25.3016529 | 1,591 | 42 |
| 23.9255101 | 23.9255101 | 1,546 | 43 |
| 22.5882902 | 22.5882902 | 1,464 | 43 |
| 21.3219967 | 21.3219967 | 2,492 | 43 |
| 19.1665297 | 19.1665297 | 1,598 | 44 |
| 17.7843322 | 17.7843322 | 1,507 | 44 |
| 16.4808456 | 16.4808456 | 1,298 | 44 |
| 15.3581345 | 15.3581345 | 1,184 | 44 |
| 14.3340282 | 14.3340282 | 2,126 | 45 |
| 12.4951346 | 12.4951346 | 1,259 | 45 |
| 11.4061567 | 11.4061567 | 1,114 | 45 |
| 10.4425973 | 10.4425973 | 983 | 45 |
| 9.5923469 | 9.5923469 | 922 | 46 |
| 8.7948587 | 8.7948587 | 1,753 | 46 |
| 7.2785932 | 7.2785932 | 977 | 46 |
| 6.4335326 | 6.4335326 | 778 | 46 |
| 5.2208662 | 5.7605979 | 1,189 | 47 |
| 4.7321668 | 4.7321668 | 1,090 | 47 |
| 3.3266155 | 3.7893662 | 946 | 47 |
| 2.3708406 | 2.9711192 | 1,315 | 47 |
| 1.1183863 | 1.8337038 | 1,158 | 48 |
| 0.0008650 | 0.8320864 | 962 | 48 |
2026-04-08 · Shift 2
| From | To | Candidates in row | PDF page |
|---|---|---|---|
| 100.0000000 | 100.0000000 | 1 | 26 |
| 99.0018009 | 99.9991424 | 1,205 | 26 |
| 98.0156076 | 98.9623531 | 1,194 | 26 |
| 97.0011148 | 97.9384272 | 1,192 | 26 |
| 96.0329303 | 96.9153589 | 1,203 | 27 |
| 95.1161993 | 95.8837149 | 1,062 | 27 |
| 94.0219535 | 94.9729869 | 1,324 | 27 |
| 93.0957894 | 93.8375783 | 1,114 | 27 |
| 92.0195524 | 92.8822571 | 1,259 | 28 |
| 91.0925307 | 91.8008747 | 1,128 | 28 |
| 90.0711774 | 90.8335477 | 1,185 | 28 |
| 89.2307692 | 89.8173399 | 1,025 | 28 |
| 88.3654918 | 88.9383415 | 1,110 | 29 |
| 87.3226996 | 87.9864506 | 1,163 | 29 |
| 86.2241660 | 86.9882514 | 1,344 | 29 |
| 85.0527399 | 85.8356916 | 1,411 | 29 |
| 84.1728840 | 84.6256753 | 1,044 | 30 |
| 83.2398594 | 83.7303833 | 1,136 | 30 |
| 82.3231284 | 82.7561959 | 1,239 | 30 |
| 81.1568476 | 81.6936798 | 1,219 | 30 |
| 80.0960467 | 80.6483149 | 1,288 | 31 |
| 79.5429208 | 79.5429208 | 798 | 31 |
| 78.1974102 | 78.8585885 | 1,500 | 31 |
| 77.5722494 | 77.5722494 | 751 | 31 |
| 76.3330761 | 76.9282223 | 1,686 | 32 |
| 75.4815196 | 75.4815196 | 888 | 32 |
| 74.7200069 | 74.7200069 | 892 | 32 |
| 73.1909785 | 73.9550639 | 1,754 | 32 |
| 72.4500472 | 72.4500472 | 1,151 | 33 |
| 71.4629963 | 71.4629963 | 1,051 | 33 |
| 70.5617014 | 70.5617014 | 1,077 | 33 |
| 69.6381099 | 69.6381099 | 946 | 33 |
| 68.0258983 | 68.8268588 | 2,286 | 34 |
| 66.8664780 | 66.8664780 | 1,213 | 34 |
| 65.8262585 | 65.8262585 | 1,180 | 34 |
| 64.8143384 | 64.8143384 | 1,185 | 35 |
| 63.7981305 | 63.7981305 | 1,055 | 35 |
| 62.8934054 | 62.8934054 | 1,675 | 35 |
| 61.4569934 | 61.4569934 | 1,430 | 35 |
| 60.2306835 | 60.2306835 | 1,424 | 36 |
| 59.0086613 | 59.0086613 | 1,294 | 36 |
| 57.8981219 | 57.8981219 | 1,279 | 36 |
| 56.8013035 | 56.8013035 | 1,840 | 36 |
| 55.2225367 | 55.2225367 | 1,570 | 37 |
| 53.8761684 | 53.8761684 | 1,446 | 37 |
| 52.6361376 | 52.6361376 | 1,448 | 37 |
| 51.3943916 | 51.3943916 | 1,338 | 37 |
| 50.2461195 | 50.2461195 | 2,100 | 38 |
| 48.4452448 | 48.4452448 | 1,718 | 38 |
| 46.9711002 | 46.9711002 | 1,648 | 38 |
| 45.5578424 | 45.5578424 | 1,542 | 38 |
| 44.2354858 | 44.2354858 | 1,425 | 39 |
| 43.0134637 | 43.0134637 | 2,350 | 39 |
| 40.9981991 | 40.9981991 | 1,762 | 39 |
| 39.4863219 | 39.4863219 | 1,702 | 40 |
| 38.0267559 | 38.0267559 | 1,631 | 40 |
| 36.6280765 | 36.6280765 | 1,516 | 40 |
| 35.3280165 | 35.3280165 | 2,476 | 40 |
| 33.2046994 | 33.2046994 | 1,775 | 41 |
| 31.6825315 | 31.6825315 | 1,746 | 41 |
| 30.1852328 | 30.1852328 | 1,632 | 41 |
| 28.7856959 | 28.7856959 | 1,436 | 42 |
| 27.5533831 | 27.5533831 | 2,458 | 42 |
| 25.4446445 | 25.4446445 | 1,741 | 42 |
| 23.9516337 | 23.9516337 | 1,547 | 43 |
| 22.6249893 | 22.6249893 | 1,422 | 43 |
| 21.4046823 | 21.4046823 | 1,344 | 43 |
| 20.2521225 | 20.2521225 | 2,216 | 43 |
| 18.3517709 | 18.3517709 | 1,501 | 44 |
| 17.0645742 | 17.0645742 | 1,336 | 44 |
| 15.9188749 | 15.9188749 | 1,299 | 44 |
| 14.8049052 | 14.8049052 | 1,092 | 45 |
| 13.8684504 | 13.8684504 | 1,863 | 45 |
| 12.2708173 | 12.2708173 | 1,206 | 45 |
| 11.2366006 | 11.2366006 | 1,107 | 45 |
| 10.2872824 | 10.2872824 | 924 | 45 |
| 9.4948975 | 9.4948975 | 826 | 46 |
| 8.7865535 | 8.7865535 | 1,420 | 46 |
| 7.5688191 | 7.5688191 | 891 | 46 |
| 6.1126833 | 6.8047337 | 1,453 | 46 |
| 5.0638882 | 5.5586999 | 1,662 | 47 |
| 4.1334362 | 4.1334362 | 571 | 47 |
| 3.2441472 | 3.6437698 | 856 | 47 |
| 2.0624303 | 2.9096990 | 1,273 | 47 |
| 1.3223566 | 1.8180259 | 955 | 48 |
| 0.0000000 | 0.9990567 | 1,166 | 48 |
A percentile is a position in a group, not percentage marks.
Original fictional example. Imagine a shift with 200 candidates. If 190 scored at or below your raw score, the illustrative percentile is 190 ÷ 200 × 100 = 95. Tied scores are included in “at or below”.
Move the control to change the count in this fictional group. It does not convert marks into an official NTA score.
Does 95 percentile mean 95 percent marks?
No. Percentage marks compares your score with the available marks. A percentile compares your position with a defined candidate group. This example supplies no raw marks, so you cannot calculate percentage marks from it. The official normalization procedure supplies the context for actual NTA scores.
Out of 200 fictional candidates
Teaching example · candidates with a score equal to or lower than yours
190 ÷ 200 × 100 = 95.00 percentile
This is a fictional cohort, not a marks-to-percentile tool.
The denominator is the fictional shift’s attendance, not the national annual total.
View the exact data
| Quantity | Value |
|---|---|
| Candidates in shift | 200 |
| Scored at or below your raw score | 190 |
| Illustrative percentile | 95.00 |
A 100 NTA score does not tell you the raw marks.
NTA lists 26 candidates with a 100 NTA score in the final Paper 1 release. That is a percentile outcome. It does not, by itself, establish that each candidate earned full raw marks.
The release also includes state topper tables. Those tables describe a small, selected group, not every candidate in a state. They cannot supply state participation rates or rank the quality of teaching. Similarly, the 13 offered examination languages do not tell us how many students chose each language.
The Advanced threshold opens a route. It is not an admission cutoff.
The category thresholds below are the lower NTA-score endpoints in the 2026 eligibility table for JEE Advanced. Other eligibility conditions still apply. They are not the closing ranks of NITs, IITs or a particular course.
Use the exact published decimals when checking this historical table. A rounded label can be useful for reading, but it must not replace a threshold in an eligibility decision.
Keep all seven decimal places
2026 NTA score thresholds for Advanced eligibility · exact lower endpoints
These source labels belong to the eligibility table. They are not college closing ranks, seat shares or a guarantee of eligibility under every condition.
View the exact data
| Source label | Lower NTA score endpoint |
|---|---|
| UR-ALL | 93.4123549 |
| UR-PwBD | 0.0023186 |
| EWS-ALL | 82.4164528 |
| OBC-ALL | 80.9232583 |
| SC-ALL | 63.9172792 |
| ST-ALL | 52.0174712 |
Separate the admission routes before counting seats.
For the B.E. and B.Tech. route discussed here, JEE Main Paper 1 ranks connect to the NIT+ system. JEE Advanced is a separate stage for the IIT/IISc route covered by the 2026 JoSAA rules. Both routes have further eligibility and allocation requirements.
A seat matrix describes capacity within its institution, programme, category and quota scope. It does not count completed admissions or remaining vacancies. To research an option, match the counselling year, rank list, programme, category, quota and round in the official records. Open the official JoSAA seat matrix.
Two admission routes to keep distinct
2026 JoSAA rules · B.E. / B.Tech. focus
JEE Main Paper 1
Rank → NIT+ programmes
Relevant programme, category, quota and other eligibility conditions apply.
JEE Advanced
Qualification → IIT / IISc route
Advanced and Class XII eligibility plus the applicable allocation requirements apply.
A qualifying examination is one step. Capacity, allocation and completed admission are different measures.
Try it: remove the duplicate counting.
Original fictional example. A January group has 120 students and an April group has 100. Forty attended both. How many distinct students attended at least one session?
Reveal the overlap calculation
120 + 100 − 40 = 180 distinct students. The sum of session attendances is 220, but 40 students occur in both lists. Subtract that overlap once. This fictional example reconciles exactly; the one-candidate issue in NTA’s actual attendance table remains flagged above.
Now imagine someone divides all JEE Main candidates by a combined IIT and NIT seat total and calls it your chance of admission. What information is missing?
Reveal the admission check
The ratio mixes admission routes and ignores the relevant rank, eligibility, course choices, category, quota, fees and allocation stage. A national count is context, not a personal probability. Capacity and actual admissions are also different measures.
Choose a useful next study step.
For preparation, use your own questions and mistakes: choose one familiar chapter, attempt a short set and identify what each error needs. Was it a concept, an algebra step, a unit or a rushed reading?
For result research, use the official scorecard and the correctly scoped counselling records. Avoid changing a study plan because of an unsupported “marks needed for this percentile” chart.
Choose your JEE subject and chapter · Read the JEE Main paper-review guide · Explore the NEET edition
Quick check: what can this data prove?
A shift has more scheduled candidates than another. A friend says this proves it was harder and therefore required fewer marks for the same percentile. Is that conclusion supported?
Check your reasoning
No. Scheduling counts establish scale. They do not establish question difficulty, attendance or a raw-score conversion. Keep each conclusion within what its source measures.
Your next study session
Practise, then review your mistakes
Suggested task: choose 10 available chapter questions, allowing about 15 minutes plus error review. Adjust the pace if you are learning the concept for the first time.
- Choose JEE, then a subject and a chapter you have already studied.
- Open notes, a mind map or a video if you need to revisit the concept; return to practice in that same chapter.
- Attempt ten available questions and write a correction for each mistake. National statistics do not predict your result.
Sources and method
Reported counts retain their source populations, precision and labels. Shares are TopAll calculations using the displayed registered or appeared denominator, rounded to two decimals. January and April are not pooled as distinct people: their attendance-overlap arithmetic is one below the reported annual total, and the difference is explicitly retained. PwBD counts overlap category totals. Shift scheduling is separate from attendance and from percentile ranges. The percentile and overlap exercises are fictional teaching examples, not actual score predictions. No state participation, language take-up, unverified seat total or future admission probability is inferred. Source PDFs and hashes are retained with the local review evidence.
- NTA final JEE Main 2026 Paper 1 result release
2026 Paper 1 · PDF pages 3-5: annual/session totals, overlap, gender/category, PwBD, eligibility thresholds and 100 NTA scores · Checked 2026-10-20
- NTA session and shift statistical appendix
2026 Paper 1 · PDF page 2: scheduled shift/gender/category counts; subsequent pages: published percentile ranges · Checked 2026-10-20
- NTA JEE Main 2026 information bulletin
2026 · PDF pages 17-18: Paper 1 format and scoring; normalization appendix, PDF pages 60-65 · Checked 2026-10-20
- JoSAA 2026 business rules
Academic year 2026-27 · PDF pages 9-12: admission routes and allocation eligibility · Checked 2026-10-20
- NTA final JEE Main 2025 Paper 1 result release
2025 annual Paper 1 · PDF page 3: annual unique registrations and attendance; compared with the same Paper 1 populations in 2026 · Checked 2026-10-20
Frequently asked questions
Start with your question. Open an answer, then choose one study task to try.
How many unique candidates appeared in JEE Main 2026 Paper 1?
NTA’s final annual table reports 15,38,468 unique appeared candidates and 16,04,854 unique registrations. The session-overlap arithmetic differs from the reported appeared total by one; this story retains and flags the source figures.
Why can I not add January and April attendance?
A candidate can appear in both sessions. Adding session attendance counts these candidates twice. You need a compatible common-candidate count when calculating a distinct annual population.
Is an NTA percentile the same as percentage marks?
No. Percentage marks compares a score with the maximum marks. A percentile describes relative position within the defined candidate group under the normalization procedure.
Does a 100 NTA score necessarily mean full raw marks?
No. It is a percentile outcome, not a statement that the candidate obtained the maximum possible raw marks.
Is the JEE Advanced eligibility threshold an NIT admission cutoff?
No. The threshold concerns eligibility for JEE Advanced, alongside other conditions. Admission cutoffs depend on the actual counselling year, rank list, institution, programme, category, quota and round.
Can shift statistics prove that a paper was easier?
Scheduled counts and percentile ranges do not by themselves establish question difficulty or a universal raw-mark target. A defensible comparison would need appropriately reviewed question and score evidence.
Can the state topper tables show my state’s participation?
No. They describe toppers within their stated state classification, not all registered or appeared candidates. They cannot be used as a state participation table.
Can these figures predict my future rank or admission?
No. The 2026 figures describe their historical populations. A later year has its own cohort, rules and papers, and admission requires appropriately scoped counselling records.